
Most traders obsess over entries and exits. Very few pay close attention to the one cost that silently bleeds every single trade — the spread. Not just the spread right now, in this moment, but how it behaves across the full trading day: how wide it spikes during the London open, how tight it gets during the New York session overlap, how it blows out on thin Friday afternoons or around high-impact news.
I built Spread Monitoring System because I wanted answers to those questions without switching windows, running scripts, or exporting data to Excel. I wanted it live, right there on the chart, all the time.
The Problem With Spread Awareness
Your broker quotes you a spread. Maybe it's 0.8 pips on EURUSD. Sounds fine. But that number is a snapshot — a single tick at the moment you checked. The reality is that variable-spread brokers widen significantly during specific windows, and if your EA is firing entries at 8:00 AM London time or 30 minutes before a US NFP release, you may be entering at 3–5 pips on a pair you think costs you under 1.
The common approach is to export tick data and analyze it offline. That works, but it's disconnected from your live trading environment, and you have to repeat it every time you want fresh data on a different pair or account.
I wanted something that runs passively in the background, accumulates data continuously, and surfaces it exactly where I need it — on the chart itself.
What the Indicator Tracks
Every tick, the utility samples the current spread and feeds three per-candle statistics: the minimum spread seen during that M1 bar, the maximum, and the average across all ticks. When the bar closes, those three values are committed to a history buffer. The buffer grows without limit — run it for a week and you have a week of per-minute spread data. Run it for a month and you have a month.
On top of the raw bar data, three moving average lines run across the chart — one each for Min, Max, and Average — smoothed over a configurable period. This lets you see not just what the spread is doing right now, but whether conditions are trending better or worse relative to recent history.
The Panel
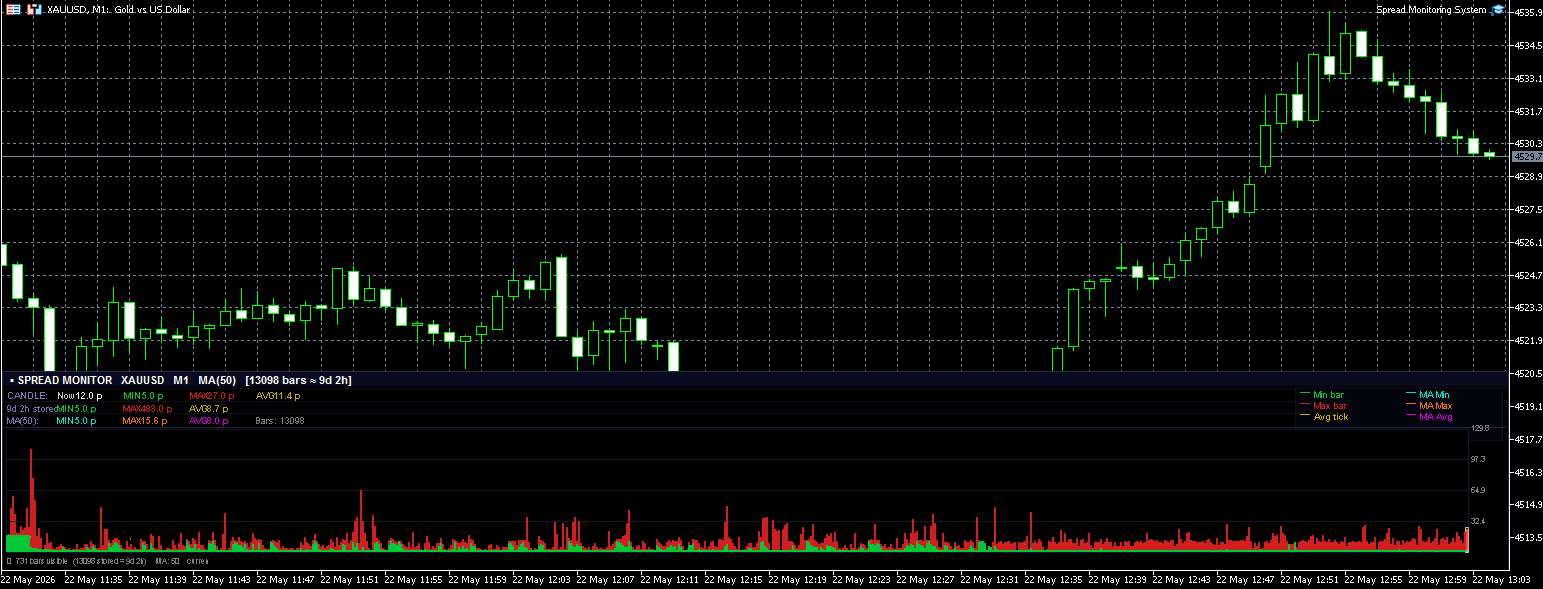
The overlay panel sits anchored to the bottom of the chart and is divided into three information rows plus the bar graph.
Candle row — tells you what the spread is doing on the current open bar: live reading, candle minimum so far, candle maximum, and candle average. This is the number that matters for decisions you're making right now.
History row — session-wide bests: the tightest spread ever recorded since the indicator started, the widest spike, and the overall average. A quick sanity check on whether the current moment is normal or abnormal.
MA row — the smoothed moving average values for Min, Max, and Avg. Useful for confirming that a session's spread conditions are improving or deteriorating relative to the recent period.
Below the rows is the bar graph — a pixel-column visualization of every visible bar in the history. Green segments represent the minimum, red the maximum range, gold dots the average tick. The three MA lines run as continuous connected curves across the chart. The current live bar is framed with a light grey outline so it's immediately distinguishable from completed bars.
How It's Built
A few technical decisions are worth explaining because they directly affect usability.
Object pooling. The graph uses one rectangle object per pixel column per data layer — up to six objects per column. Rather than deleting and recreating these objects on every redraw (which would cause visible flicker and unnecessary object churn), the utility creates the pool once when the chart first loads and simply repositions and recolors the objects each frame. The result is a smooth, flicker-free update at 200 ms intervals regardless of how many bars are stored.
Unlimited history. There's no fixed cap on how many bars are stored. The internal array starts at 1,440 entries (one day of M1 bars) and grows by another 1,440 each time it fills. Memory usage remains trivial — a few kilobytes per additional day — so you can leave it running for as long as you want.
Broker-agnostic pip calculation. The spread is always expressed in pips, not points. The utility automatically detects 5-digit and 3-digit brokers and divides accordingly, so the numbers are consistent and meaningful regardless of which account type you're using.
No DLL, no external dependencies. The entire utility is a single .ex5 file. Attach it to any chart and it starts working immediately.
Practical Uses
A few ways I personally use this tool:
-
Session mapping. Leave it running on your main pairs for a week. You'll quickly build an accurate picture of which sessions are genuinely cheap to trade on your broker versus which sessions carry hidden execution costs.
-
EA timing. Before deploying an EA, check whether its preferred entry windows correspond to low-spread periods. If an EA likes opening trades at the start of the London session and the spread routinely triples at that time, the backtest economics are unrealistic.
-
Broker comparison. Run the same utility across demo accounts on two different brokers simultaneously. The history rows give you a direct, apples-to-apples comparison after a few days.
-
News event monitoring. Watch how far in advance the spread begins widening before scheduled events. Some brokers start widening 5–10 minutes ahead; others stay tight until seconds before.
Configuration
All visual and behavioral parameters are exposed in the input panel:
| Parameter | Default | Description |
|---|---|---|
| MA Period | 50 | Smoothing period for all three MA lines |
| Panel Height | 200 px | Height of the overlay panel |
| Offset Bottom | 0 px | Vertical offset from chart bottom |
| Offset Right | 0 px | 0 = full chart width |
| All colors | — | Individual color control for every element |
The color scheme defaults to a dark, terminal-style palette that stays readable against both dark and light chart backgrounds, but everything can be overridden.
The utility is available on the MQL5 Market:
MT4 Version:https://www.mql5.com/en/market/product/177872
MT5 Version:https://www.mql5.com/en/market/product/177725
It runs on MetaTrader 4/5. Attach it to any chart on any symbol — it adapts to the current symbol and timeframe automatically.(Recommended to use M1)
If you have questions, feature requests, or want to report an issue, leave a comment on the Market page or reach out via the MQL5 profile. Or you can contact me on Telegram
Happy trading.


 Trading Guide")

")