
Apex Break PRO: Non-Repainting Pivot Trendline Breakout Indicator with 4-Layer Confluence Scoring

Trendline breakouts remain one of the most reliable signals in technical analysis, yet drawing trendlines by hand is slow, subjective, and prone to inconsistency. A line that looks valid on a 1-hour chart may be drawn differently by two traders looking at the same data. Even the same trader may draw different lines depending on whether they zoom in or out, which pivot points they select, and how far they extend the line. This subjectivity leads to missed entries, late exits, and an inability to systematically backtest what should be a straightforward concept.
Apex Break PRO automates the entire process. It detects pivot highs and pivot lows in real time, connects consecutive pivots with dynamically sloped trendlines, and fires breakout signals only when a confirmed bar close exceeds the trendline by a meaningful margin. Every signal must also pass through a 4-layer confluence scoring system that evaluates trend direction, momentum boundaries, volume participation, and trend strength before the indicator prints an arrow on the chart.
The indicator is available for both MetaTrader 4 and MetaTrader 5.
Product Links
The non-repainting architecture ensures that every signal printed on the chart is permanent -- it evaluates conditions only on closed bars and never modifies or removes historical arrows. The built-in risk management module calculates ATR-based stop loss and three take profit levels for each signal, with automatic hit detection and color-coded chart zones. A real-time dashboard displays the current signal direction, filter status, and trade management data in a persistent on-chart panel.
This article explains the technical concepts behind pivot trendline trading, walks through each component of the indicator, and provides a complete parameter reference so that readers can configure it for their own markets and timeframes.
What Is Pivot Trendline Trading
A pivot high is a bar whose high is greater than the highs of all surrounding bars within a defined lookback window. A pivot low is the mirror: a bar whose low is lower than the lows of all surrounding bars. These pivots mark the points where price temporarily reversed, and they serve as structural anchors for the market.
Consider a daily chart of any currency pair. Over the past 100 bars, there may be four or five distinct swing highs where price peaked and pulled back. Each of those peaks is a candidate pivot high. Similarly, there will be several swing lows where price bottomed and bounced. Each of those troughs is a candidate pivot low. The key word is "candidate" -- a genuine pivot requires confirmation from the bars that follow it, not just the bars that precede it.
When two consecutive pivot highs are connected by a straight line, the result is a resistance trendline. It slopes upward if highs are rising and downward if highs are falling. The same logic applies to pivot lows, which produce support trendlines. The slope of each line captures the rate at which buyers or sellers are gaining or losing ground.
A breakout occurs when price closes decisively beyond one of these trendlines. A close above a resistance trendline suggests that buyers have overcome selling pressure at that slope, potentially initiating a new bullish leg. A close below a support trendline suggests that sellers have broken through buying pressure, potentially starting a bearish move.
The reason pivot trendline breakouts carry weight is that they represent a shift in the structural balance of supply and demand. Unlike a reaction to a fixed price level, a trendline breakout means that the rate of change in market structure has been disrupted. A rising support line that gets broken implies that buyers are no longer willing to defend progressively higher prices, which often precedes a more significant decline.
Conversely, when price breaks above a falling resistance trendline (a line connecting lower highs), it signals that sellers are losing their grip on the market. Each failed attempt to push price lower was less successful than the last, and the breakout represents the point where buyers finally overwhelmed the declining selling pressure. These moments of structural change are precisely what Apex Break PRO is designed to identify and signal.
The Problem with Static Support and Resistance
Horizontal support and resistance levels are the most common tool in technical analysis. A trader identifies a price level where the market previously reversed, draws a horizontal line, and watches for a reaction when price returns to that zone. This method works well in ranging markets where price oscillates between fixed boundaries.
However, this approach has a fundamental limitation: markets in trends do not move horizontally. An uptrend creates rising floors and falling ceilings. A stock in a sustained uptrend will print higher lows over time, meaning the relevant support level rises with each swing. A horizontal line drawn at an earlier low becomes increasingly irrelevant as the trend progresses -- price may never return to test it.
The problem is symmetric in downtrends. Resistance levels established during a decline become obsolete as the market moves lower. By the time a correction brings price back toward an old resistance level, the dominant sellers may be operating at entirely different price zones.
Static levels also fail to capture the rate of change in market structure. Two markets may both have support at 1.2000, but one may have pivots rising at 10 pips per day while the other has pivots rising at 2 pips per day. This difference in slope carries important information about momentum and buyer conviction that a horizontal line cannot represent.
There is also a temporal problem. A horizontal level drawn at a pivot from 200 bars ago carries no information about what has happened in the intervening period. The market may have tested that level zero times or twenty times since it was drawn. A sloped trendline, by contrast, is continuously projected forward and continuously tested by incoming price data, making it inherently more responsive.
Sloped trendlines solve these problems. They move with the market, tracking the evolving structure of higher lows or lower highs. They encode both the level and the velocity of structural change, giving traders a more accurate picture of where supply and demand are likely to interact next.
The challenge, however, is that drawing trendlines manually introduces the very subjectivity that technical analysis seeks to eliminate. Which two pivot points should be connected? How far should the line extend? Should it be redrawn when a new pivot forms? Automating this process with clear rules -- specific pivot detection parameters, a defined extension limit, and objective breakout criteria -- removes ambiguity and makes the method testable and repeatable.
Dynamic Sloped Trendlines Explained
Apex Break PRO identifies pivots using a configurable lookback window. By default, the indicator uses 20 bars on each side (PivotLeftBars = 20, PivotRightBars = 20), meaning a pivot high is confirmed only when the bar's high exceeds the highs of the 20 bars before it and the 20 bars after it. This requirement for 20 bars of confirmation on the right side ensures that pivots are never identified prematurely.
The choice of 20 bars for both left and right parameters creates a balance between sensitivity and reliability. Smaller values (such as 5 or 10) detect more pivots, including minor swings, which produces more trendlines and more frequent signals. Larger values (such as 30 or 50) detect only major structural pivots, producing fewer but higher-significance trendlines. Traders working on lower timeframes like M15 may prefer smaller pivot values to capture intraday swings, while those on H4 or D1 may keep the defaults or increase them.
When a new pivot high is detected, the indicator checks whether a previous pivot high exists. If it does, a resistance trendline is drawn from the previous pivot high to the new one. The slope is calculated as the price difference divided by the bar distance between the two pivots. A positive slope means resistance is rising (higher highs); a negative slope means resistance is falling (lower highs). The line then extends forward by up to 500 bars (MaxLineExtension = 500) to project where resistance may appear in the future.
The same process applies to pivot lows. Each new pivot low generates a support trendline connecting it to the previous pivot low, with the line extending forward. A rising support line (positive slope) indicates an uptrend with higher lows, while a falling support line indicates a downtrend with lower lows.
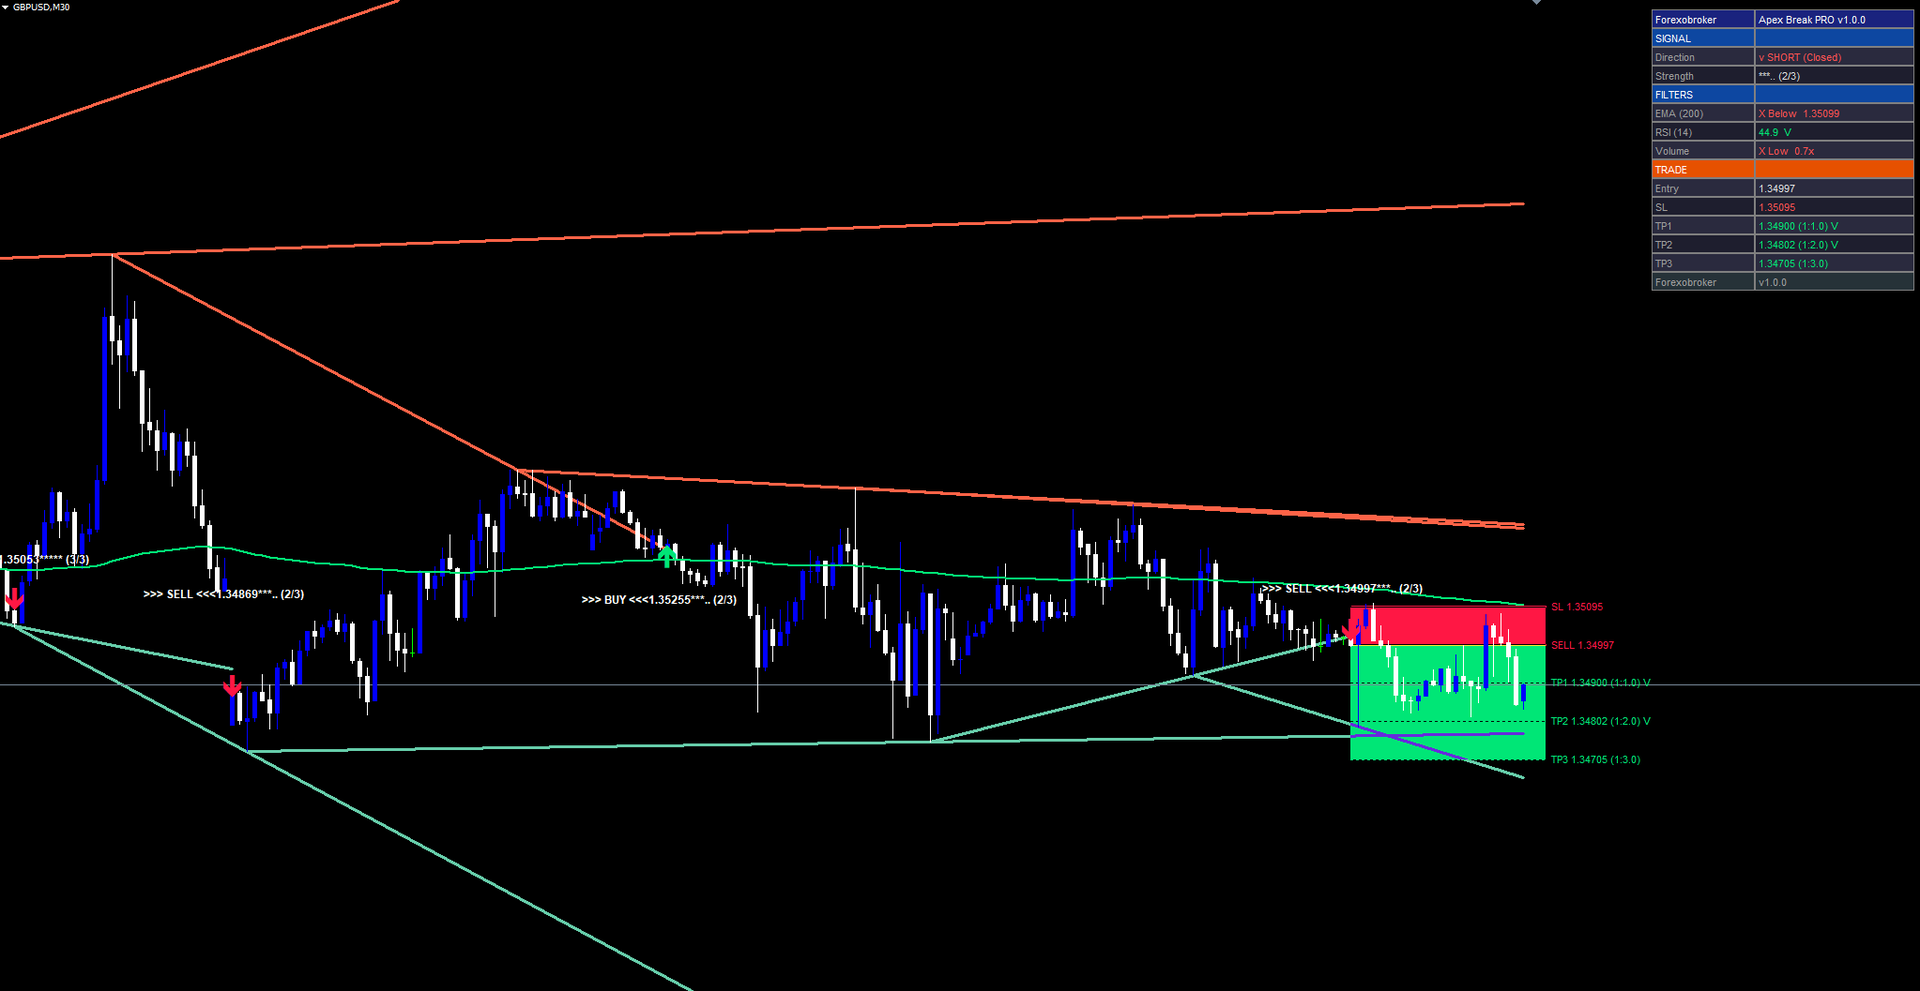
Active trendlines are drawn as solid lines with a configurable width (LineWidth = 3). When a trendline is broken by a price close or when it reaches its maximum extension of 500 bars, it transitions to a dashed style. This visual distinction allows traders to see at a glance which trendlines are still in play and which have been invalidated. Resistance lines use the ResistanceColor (default: clrTomato) and support lines use SupportColor (default: clrMediumAquamarine), creating an immediate visual separation between selling pressure and buying pressure on the chart.
The indicator maintains a maximum of 5 resistance lines and 5 support lines by default (MaxResistanceLines = 5, MaxSupportLines = 5). When a new trendline is created and the limit has been reached, the oldest line is removed from the chart. This automatic cleanup keeps the chart readable by preventing an accumulation of dozens of outdated lines. Setting either parameter to 0 removes the limit entirely and displays all detected lines, which can be useful for analysis purposes but may make the chart visually busy on lower timeframes with frequent pivot formation.
Non-Repainting Breakout Detection
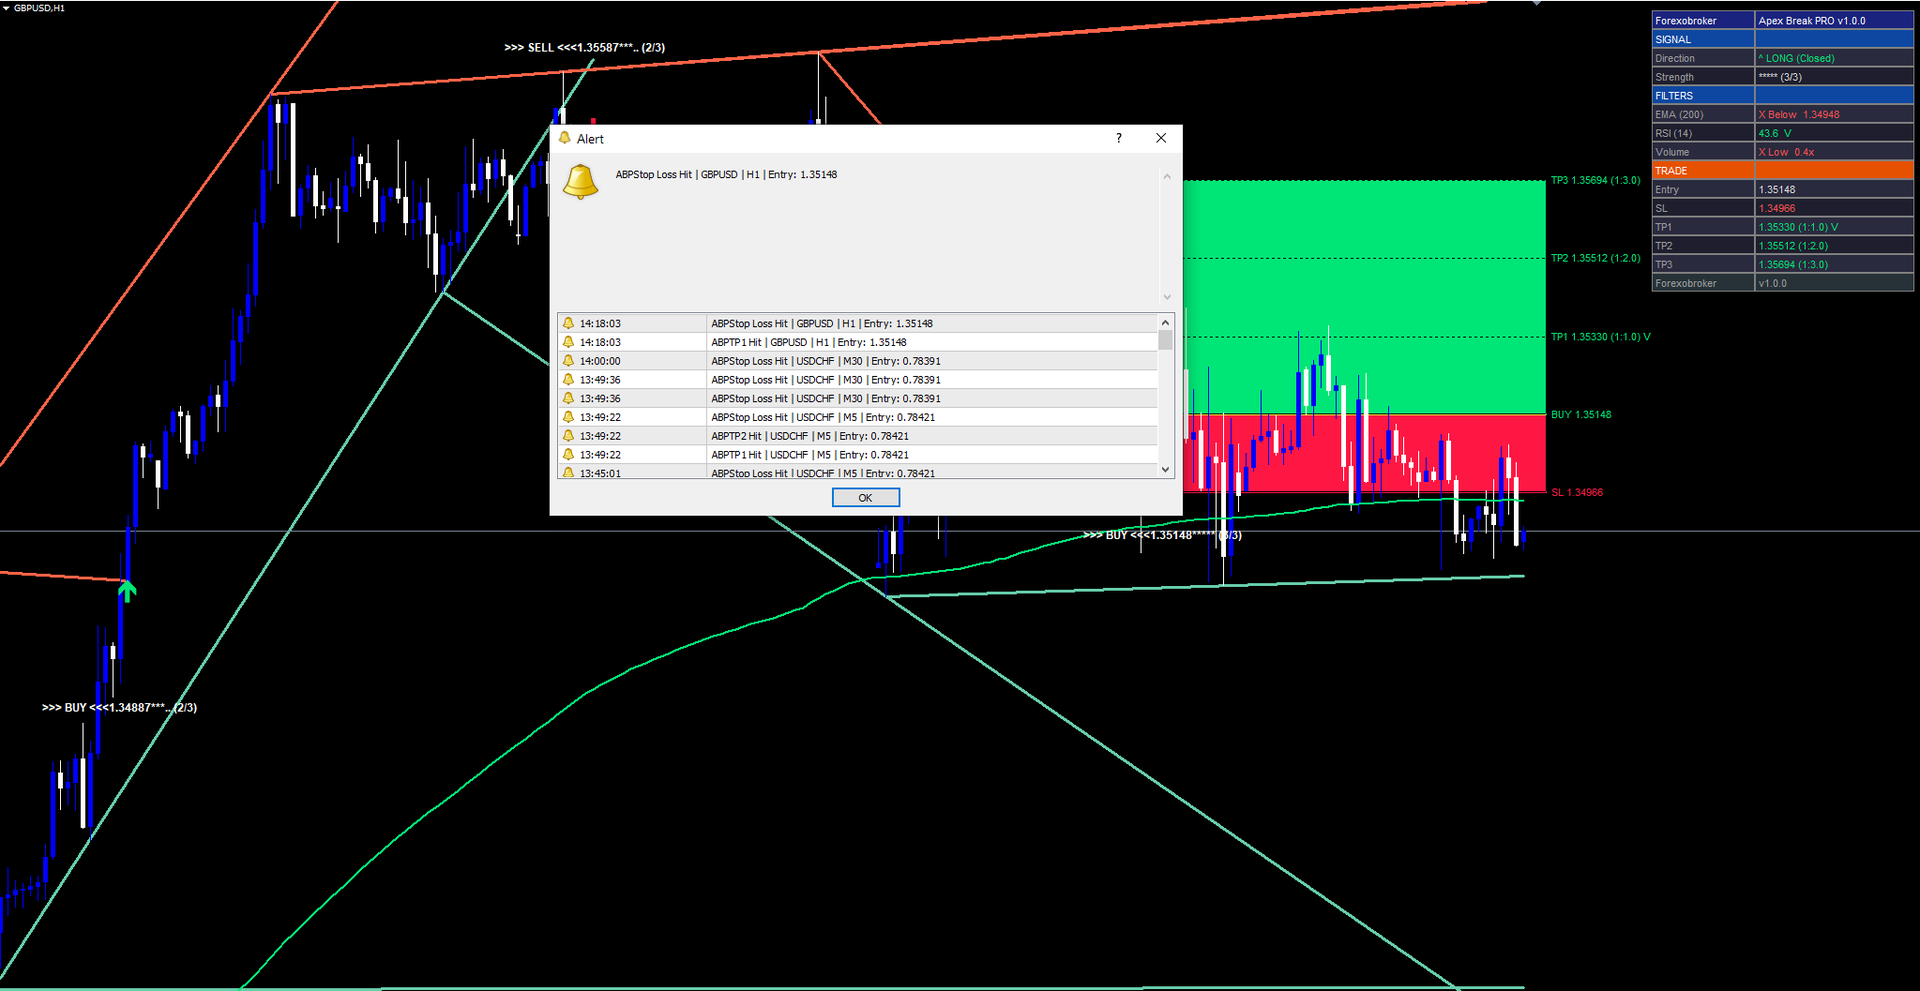
Repainting is one of the most common problems with breakout indicators, and it is also one of the most misunderstood. An indicator that evaluates conditions on the current, still-forming bar can show a signal that disappears when the bar closes at a different price. During the bar's formation, price may temporarily breach a trendline, causing the indicator to display a buy arrow. If price then pulls back before the bar closes, the arrow vanishes as if it never existed. This creates a false impression of accuracy in backtesting -- every signal on the chart appears to have been perfectly placed, because all the "wrong" signals were silently removed.
Apex Break PRO eliminates repainting through a strict evaluation rule: breakout signals are calculated only on confirmed (closed) bars. The indicator checks whether the close of a completed bar has exceeded the projected trendline price at that bar. If the bar is still forming (the rightmost bar on the chart), no signal evaluation occurs. Once a signal is printed, it never moves, changes, or disappears.
This design has an important practical consequence: the signal appears at the close of the breakout bar, not at the moment price first crosses the trendline. A trader will see the arrow on the bar that just completed. The entry price shown in the dashboard corresponds to the close of that confirmed bar. This one-bar delay relative to the initial cross is the cost of non-repainting integrity, and it is a trade-off that serious traders universally prefer over signals that look perfect in hindsight but shift during live trading.
In addition to the confirmed-bar requirement, the indicator applies a breakout margin. Rather than triggering on any close beyond the trendline, the close must exceed the line by at least 0.1 times the current ATR value (MarginMultiplier = 0.1). This margin filters out marginal touches and false breaks that often occur when price merely grazes a trendline without committing to a genuine breakout. On a pair like EURUSD with an ATR of 50 pips, the breakout margin would be 5 pips. On a more volatile pair with an ATR of 150 pips, the margin would be 15 pips. This adaptive scaling ensures that the margin is meaningful regardless of the instrument or timeframe.
A signal cooldown of 5 bars (SignalCooldown = 5) prevents the indicator from firing multiple signals in rapid succession during choppy breakout conditions. After a buy signal fires, the next buy signal can only appear at least 5 bars later. The same rule applies independently to sell signals. Buy and sell cooldowns are tracked separately, so a sell signal can fire immediately after a buy signal if the market reverses sharply, but two consecutive buy signals must be spaced by at least 5 bars. This cooldown eliminates whipsaw clusters that would otherwise make the indicator difficult to trade.
The 4-Layer Confluence Scoring System
A trendline breakout alone is not sufficient for a high-quality trade signal. Price can break through a trendline during low-volume periods, against the dominant trend, or at extreme momentum levels where a reversal is imminent. Many traders have experienced the frustration of entering a breakout only to see price immediately reverse because the move lacked institutional participation or occurred in an exhausted market.
The confluence scoring system addresses each of these failure modes with four independent filters. Each filter evaluates a different dimension of market context, and together they form a multi-factor validation gate that breakout signals must pass through before reaching the chart.
Layer 1: EMA Trend Filter (enabled by default). The indicator calculates a 200-period Exponential Moving Average (EmaLength = 200) and optionally displays it on the chart (ShowEmaOnChart = true). Buy signals are only permitted when the close is above the EMA, confirming that the broader trend supports long entries. Sell signals are only permitted when the close is below the EMA. The 200 EMA is widely regarded as the institutional trend benchmark, and this single filter eliminates counter-trend breakouts that have a statistically lower success rate. Traders who prefer a faster trend reference can reduce EmaLength to 100 or 50, though shorter periods will allow more counter-trend signals through.
Layer 2: RSI Boundary Filter (enabled by default). A 14-period RSI (RsiLength = 14) monitors momentum extremes. Buy signals are blocked when the RSI exceeds 75 (RsiOverbought = 75), indicating that momentum is overextended to the upside and a pullback is likely. Sell signals are blocked when the RSI falls below 25 (RsiOversold = 25), indicating oversold conditions where a bounce is probable. Note that the RSI filter does not require RSI to be trending in the signal direction -- it only blocks signals at extreme readings. A buy signal with RSI at 60 passes the filter; a buy signal with RSI at 78 does not. This boundary approach preserves mid-range breakouts while filtering out only the statistically weakest momentum environments.
Layer 3: Volume Spike Filter (enabled by default). Genuine breakouts are typically accompanied by above-average volume, reflecting broad market participation in the move. The indicator calculates the 20-period Simple Moving Average of tick volume (VolumeAvgLength = 20) and requires current bar volume to exceed 1.2 times that average (VolumeMultiplier = 1.2). Breakouts on thin volume are often false moves driven by a small number of participants rather than broad market conviction. The 1.2x threshold is intentionally moderate -- it does not require a dramatic volume spike, only a meaningful increase above the recent average. For instruments where tick volume data is not available (volume reads as zero), the filter automatically passes so that signals are not blocked by missing data.
Layer 4: ADX Trend Strength Filter (disabled by default). When enabled, the indicator calculates the 14-period Average Directional Index (AdxLength = 14) and requires ADX to exceed 20.0 (AdxThreshold = 20.0). ADX measures the strength of a trend without regard to its direction -- a value above 20 indicates that price is moving directionally rather than oscillating in a range. This filter ensures that breakouts occur in trending environments rather than during range-bound consolidation. The filter is disabled by default because some traders prefer to identify breakouts at the very start of a trend, before ADX has risen above the threshold. Enabling it produces fewer but more directionally committed signals.
Each enabled filter that passes adds one point to the confluence score. The signal fires only when the total score meets or exceeds the minimum confluence threshold, which defaults to 2 (MinConfluence = 2). With three filters enabled by default (EMA, RSI, Volume), a minimum of 2 out of 3 must pass before any arrow appears on the chart. Setting MinConfluence to 3 would require all three enabled filters to pass, producing fewer but more selective signals. Setting it to 1 would allow signals where only one filter confirms, which increases signal frequency at the cost of lower average quality.
If all four filters are enabled, the maximum possible score is 4, and MinConfluence = 2 means that half the filters must agree. This flexibility allows traders to tune the indicator's selectivity to match their risk tolerance and trading style.
The dashboard displays the confluence as a star rating from 1 to 5 stars, scaled proportionally to the number of enabled filters. The mapping works as follows: the raw score (for example, 2 out of 3) is converted to a 5-star scale using the formula round(score * 5 / maxScore) . A signal that passes all enabled filters receives 5 stars and a "Strong" rating. One that passes 80% or more of enabled filters is also "Strong." Scores between 50% and 80% receive "Moderate," and anything below 50% is "Weak."
This tiered approach allows traders to quickly distinguish between signals where every condition aligns and signals that meet the minimum threshold but lack full conviction. Some traders may choose to take only "Strong" signals, while others use "Moderate" signals as secondary opportunities with reduced position sizes.
ATR-Based Risk Management
Every signal generated by Apex Break PRO includes a complete risk management framework calculated from the Average True Range. ATR measures the average range between the high and low of each bar over a given period, factoring in gaps. This makes it an adaptive proxy for volatility that naturally adjusts to different instruments and timeframes. A pair like GBPJPY with wide daily ranges will produce larger ATR values and correspondingly wider stop losses than a pair like EURGBP with narrow ranges. Using ATR for stop loss and take profit levels means that the risk parameters automatically adjust to current market conditions without the trader needing to manually recalculate distances for each instrument.
The stop loss is placed at 1.5 times the 14-period ATR from the entry price (SlMultiplier = 1.5, AtrPeriod = 14). For a buy signal, the stop loss is below the entry; for a sell signal, it is above. This distance is wide enough to avoid being stopped out by normal market noise, while still limiting the maximum loss per trade. For example, if the ATR on EURUSD H1 is currently 30 pips, the stop loss would be placed 45 pips from entry (1.5 x 30). On a more volatile pair where ATR is 80 pips, the stop would be 120 pips from entry. The multiplier can be increased for wider stops on noisy instruments or decreased for tighter risk on smooth-trending ones.
Three take profit levels are calculated using fixed risk-reward ratios relative to the stop loss distance:
- TP1 at 1:1 risk-reward (TP1_RR = 1.0) -- the take profit distance equals the stop loss distance.
- TP2 at 1:2 risk-reward (TP2_RR = 2.0) -- the take profit is twice the stop loss distance.
- TP3 at 1:3 risk-reward (TP3_RR = 3.0) -- the take profit is three times the stop loss distance.
The indicator automatically tracks whether each level has been reached. When price touches TP1, TP2, or TP3, the dashboard marks that level with a checkmark (V). If the stop loss is hit, the trade is marked as closed. The trade also closes automatically when TP3 is reached.
Color-coded fill zones provide instant visual feedback on the chart. The area between entry and stop loss is shaded in red (using the SellSignalColor), representing the risk zone. The area between entry and the furthest visible take profit is shaded in green (using the BuySignalColor), representing the reward zone. These zones are drawn as rectangles that extend from the signal bar to the current bar, making the risk-reward profile of each trade visible at a glance.
The visual ratio of green to red immediately communicates the trade's asymmetry. With the default TP3 at 1:3 risk-reward, the green zone is always three times the height of the red zone, providing a constant visual reminder of the favorable risk-reward structure.
This multi-target approach supports several position management strategies. A trader using three equal portions could close one-third at TP1 to lock in a breakeven trade, move the stop loss to entry, close another third at TP2, and let the final third run to TP3. Alternatively, a trader who prefers simplicity can hide TP1 and TP2 (ShowTP1 = false, ShowTP2 = false) and manage the trade as a single entry with a 1:3 risk-reward target.
If ATR-based stop loss is not desired, the indicator can fall back to a percentage-based stop loss (SlPercent = 1.0), though ATR mode is enabled by default (UseAtrSL = true) and is recommended for most use cases.
The Real-Time Dashboard
The dashboard is a persistent panel displayed in the top-right corner of the chart by default (DashCorner = CORNER_RIGHT_UPPER). It provides a structured overview of the current signal state, filter conditions, and trade management data without requiring the trader to interpret the chart visually. Rather than scanning the chart for the most recent arrow and mentally reconstructing which filters passed, the trader can look at a single panel and see every relevant data point.
The panel is organized into a two-column layout with four sections. The left column contains labels and the right column contains values. Colors are used consistently: green for passing conditions and bullish states, red for failing conditions and bearish states, and muted gray for neutral or inactive items.
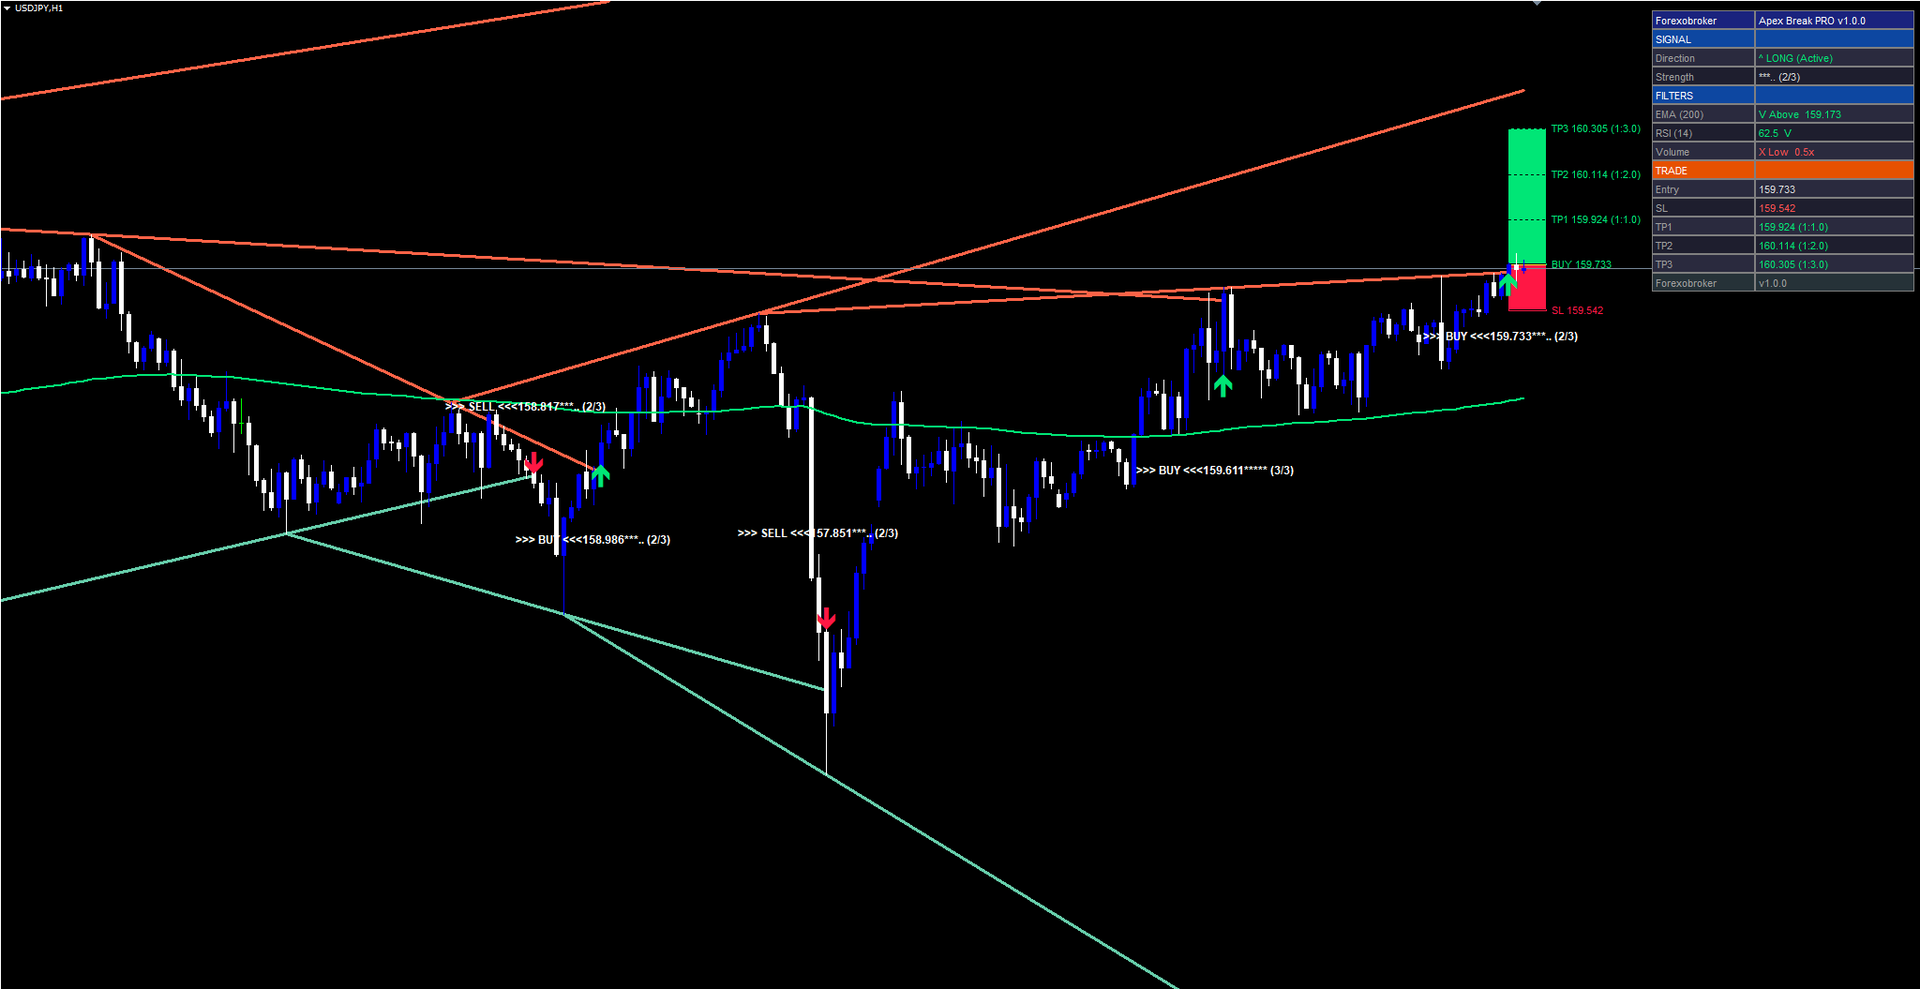
Signal Section. Two rows display the current trade direction and signal strength. The direction row shows one of three states: "^ LONG (Active)" when a buy trade is open, "v SHORT (Active)" when a sell trade is open, "^ LONG (Closed)" or "v SHORT (Closed)" when a completed trade's TP3 or SL has been hit, and "- WAITING" when no signal has been generated. The strength row displays the star rating (for example, "*.. (3/3)") alongside the confluence score ratio.
Filters Section. Each enabled filter occupies one row, and disabled filters are not displayed. The EMA row shows "V Above" or "X Below" alongside the current EMA price value. The RSI row shows the current RSI reading (for example, "62.3") with a pass or fail marker. The Volume row shows "V Spike" or "X Low" with the current volume ratio relative to its SMA (for example, "1.8x"). The ADX row, when enabled, shows the ADX value with a pass or fail indicator based on the configured threshold. Pass conditions are displayed in green text; fail conditions in red text. This color coding allows traders to identify at a glance which filters are aligned and which are not, helping with discretionary decisions about whether to take a signal that meets the minimum confluence but has specific filters failing.
Trade Section. This section has its own orange header to distinguish it from the filter section. Five rows display the Entry price, Stop Loss price (shown in red), TP1 price with its risk-reward ratio (1:1.0), TP2 price (1:2.0), and TP3 price (1:3.0). All TP values are shown in green. When a target is hit during the life of the trade, a "V" checkmark appears next to the price. If no trade is active, all fields display a dash. The trade section updates on every tick, so the hit checkmarks appear in real time as price reaches each level.
Footer. A single row displays the author branding ("Forexobroker") and version number ("v1.0.0").
The dashboard dynamically adjusts its row count based on which filters are enabled. If the ADX filter is disabled (the default), its row does not appear, and the panel is shorter. If all four filters are enabled, the panel expands to accommodate the additional row. This prevents wasted space on the chart.
The dashboard repositions automatically when the chart is resized or when the corner setting is changed. Internally, all objects are anchored to CORNER_LEFT_UPPER with absolute pixel coordinates computed from the chart width and height. This approach avoids the common MetaTrader pitfall where objects anchored to CORNER_RIGHT_UPPER extend off-screen on certain chart sizes. The DashCorner input lets traders choose their preferred visual position (right-upper, left-upper, right-lower, or left-lower), but the underlying pixel calculation always produces correct placement.
The Alert System
Automated alerts are essential for traders who monitor multiple instruments or cannot watch charts continuously. Apex Break PRO supports six distinct alert conditions, each covering a critical moment in the lifecycle of a trade:
- Buy Signal -- fires when a new buy breakout passes all confluence requirements.
- Sell Signal -- fires when a new sell breakout passes all confluence requirements.
- TP1 Hit -- fires when price reaches the first take profit level.
- TP2 Hit -- fires when price reaches the second take profit level.
- TP3 Hit -- fires when price reaches the third take profit level.
- SL Hit -- fires when price reaches the stop loss level.
Each alert includes contextual information: the symbol, timeframe, entry price, and (for signal alerts) the confluence score, star rating, strength classification, stop loss, and all three take profit prices.
Buy and sell signal alerts contain comprehensive trade information including the confluence score, star rating, strength classification, and all four price levels (SL, TP1, TP2, TP3). TP and SL hit alerts include the original entry price for reference. This allows traders to act on the information in the alert message alone, without needing to open the chart immediately.
Four delivery channels can be configured independently:
| Channel | Default | Parameter |
|---|---|---|
| Popup (on-screen dialog) | Enabled | AlertPopup = true |
| Sound (alert.wav) | Enabled | AlertSound = true |
| Push notification (mobile) | Disabled | AlertPush = false |
| Disabled | AlertEmail = false |
All alerts are guarded by a once-per-bar mechanism. Each of the six conditions stores the timestamp of the last bar on which it fired. If the same condition triggers again on the same bar (for example, during a volatile bar where price crosses and recrosses a TP level), the alert will not fire a second time. This prevents duplicate notifications that would otherwise overwhelm the trader on volatile bars.
The master switch (EnableAlerts = true) must be active for any alerts to fire. When disabled, all six conditions are suppressed regardless of individual channel settings. A recommended configuration for traders who want to be notified only of new entries would be to enable AlertPush for mobile notifications while keeping AlertPopup and AlertSound enabled for real-time desktop awareness.
Practical Trading Workflow
Understanding each component of the indicator individually is important, but applying them in a structured workflow is what produces consistent results. The following six-step workflow describes how to use Apex Break PRO in daily trading.
Step 1: Add the indicator to a chart. Open any chart in MetaTrader 4 or MetaTrader 5. Find Apex Break PRO in the Navigator panel under Indicators > Market. Drag it onto the chart. The default settings are designed to work on most instruments without modification. Start with a 1-hour or 4-hour chart to see clearly defined trendlines and well-spaced signals.
Step 2: Configure filters for your market. Review the four confluence filters. For Forex majors on the 1H timeframe, the defaults (EMA 200, RSI 14, Volume 1.2x) work well. For Crypto pairs, where volume patterns differ significantly and spikes are more extreme, consider adjusting VolumeMultiplier to 1.5 or higher. For low-volatility instruments like certain Forex crosses, enable the ADX filter (UseAdxFilter = true) to avoid signals during range-bound consolidation. For indices and commodities, the default settings generally produce good results without modification.
Step 3: Wait for a signal. The indicator continuously monitors for trendline breakouts. When a confirmed bar close exceeds a resistance or support trendline and enough confluence filters pass, a buy or sell arrow appears on the chart. A text label accompanies the arrow showing the entry price, star rating, and confluence score (for example, ">>> BUY <<< 1.08523 *.. (3/3)"). Do not anticipate signals before the bar closes -- the indicator deliberately waits for bar confirmation to ensure non-repainting integrity.
Step 4: Check the dashboard. When a signal fires, review the dashboard panel. Check the strength rating -- aim for "Moderate" or "Strong" for higher-confidence trades. Review the Filters section to see which individual filters passed (marked with "V" in green) and which failed (marked with "X" in red). Examine the Trade section for the exact Entry, SL, TP1, TP2, and TP3 prices to understand the complete risk-reward profile before committing capital.
Step 5: Set alerts for trade management. Enable push notifications (AlertPush = true) or email alerts (AlertEmail = true) for TP1 Hit, TP2 Hit, TP3 Hit, and SL Hit. This allows you to monitor target progression without watching the chart continuously. Consider scaling out at TP1 and TP2, with the final portion targeting TP3. The alert messages include the symbol, timeframe, and entry price, so you can identify which trade and chart the notification refers to even if you have the indicator running on multiple charts simultaneously.
Step 6: Monitor TP/SL progression. The dashboard and chart fill zones update in real time. As each target is reached, the dashboard displays a checkmark next to that TP level. The color-coded fill zones on the chart provide an immediate visual summary: red for the risk zone between entry and stop loss, green for the reward zone between entry and TP3. If the stop loss is hit, the trade direction resets and the dashboard returns to the "Closed" state. If TP3 is reached, the trade also closes. Review the outcome and proceed to the next signal.
Timeframe Considerations
The indicator adapts to any timeframe, but different timeframes produce different signal characteristics.
On lower timeframes (M5, M15), pivots form more frequently, resulting in more trendlines and more signals. The EMA 200 covers a shorter absolute time period (approximately 16 hours on M5), so trend alignment shifts more often. Signals on lower timeframes are best suited for scalping or short-duration intraday trades.
On medium timeframes (M30, H1, H4), the indicator produces well-spaced signals with meaningful trendlines that reflect multi-day or multi-week market structure. The EMA 200 on H1 covers approximately 8 trading days, providing a solid trend reference. These timeframes offer the best balance between signal frequency and signal quality for swing traders.
On higher timeframes (D1, W1), each signal carries significant weight but signals are infrequent. The trendlines connect major structural pivots, and breakouts tend to initiate large moves. Traders using daily or weekly timeframes should be prepared for wider ATR-based stops and longer holding periods.
Multi-Chart Setup
Because the indicator operates independently on each chart, traders can add it to multiple instruments and timeframes simultaneously. Each instance maintains its own trendline database, signal state, and dashboard. Combined with push notification alerts, this allows monitoring of a watchlist of 10 or more instruments without manually switching between charts.
A practical approach is to set up the indicator on the 1-hour chart for each of your primary trading instruments, with AlertPush enabled and AlertPopup disabled. This way, you receive a mobile notification when any instrument generates a signal, and you can then open MetaTrader to review the dashboard and chart context before deciding whether to enter the trade. For instruments you watch on multiple timeframes, consider adding the indicator to both the H1 and H4 charts -- a signal that appears on both timeframes simultaneously carries additional confluence beyond what the indicator's internal filters provide.
Parameter Reference
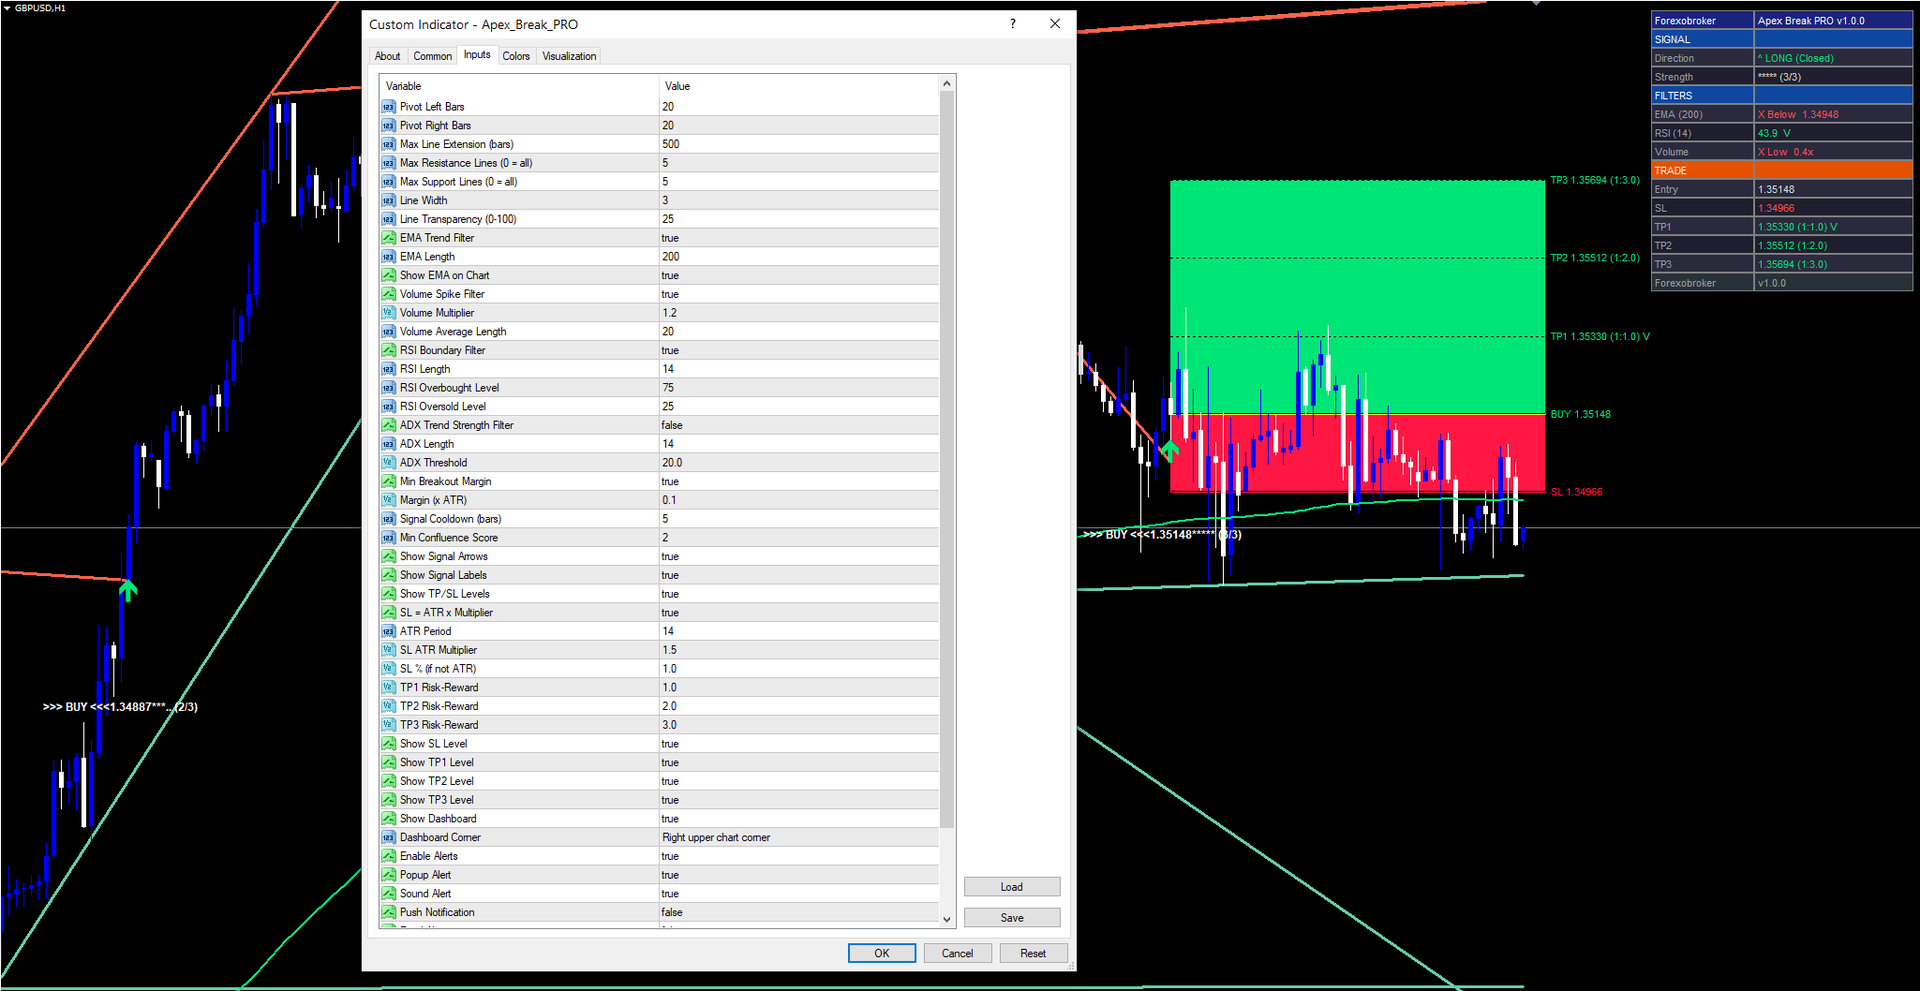
All 34 input parameters are listed below, grouped by function. Default values match the source code exactly. Parameters can be modified through the indicator's Input tab when adding it to a chart or by right-clicking the indicator and selecting Properties.
Pivot Detection
| Parameter | Default | Description |
|---|---|---|
| PivotLeftBars | 20 | Number of bars to the left required for pivot confirmation |
| PivotRightBars | 20 | Number of bars to the right required for pivot confirmation |
| MaxLineExtension | 500 | Maximum number of bars a trendline extends forward |
Line Display
| Parameter | Default | Description |
|---|---|---|
| MaxResistanceLines | 5 | Maximum resistance lines displayed (0 = unlimited) |
| MaxSupportLines | 5 | Maximum support lines displayed (0 = unlimited) |
| LineWidth | 3 | Pixel width of trendlines |
| LineTransparency | 25 | Trendline transparency (0-100) |
Signal Filters
| Parameter | Default | Description |
|---|---|---|
| UseEmaFilter | true | Enable/disable the EMA trend filter |
| EmaLength | 200 | Period for the Exponential Moving Average |
| ShowEmaOnChart | true | Draw the EMA line on the chart |
| UseVolumeFilter | true | Enable/disable the volume spike filter |
| VolumeMultiplier | 1.2 | Volume must exceed this multiple of its SMA |
| VolumeAvgLength | 20 | Period for the volume Simple Moving Average |
| UseRsiFilter | true | Enable/disable the RSI boundary filter |
| RsiLength | 14 | Period for the Relative Strength Index |
| RsiOverbought | 75 | RSI level above which buy signals are blocked |
| RsiOversold | 25 | RSI level below which sell signals are blocked |
| UseAdxFilter | false | Enable/disable the ADX trend strength filter |
| AdxLength | 14 | Period for the Average Directional Index |
| AdxThreshold | 20.0 | Minimum ADX value required for the filter to pass |
| UseBreakoutMargin | true | Enable/disable the ATR-based breakout margin |
| MarginMultiplier | 0.1 | Breakout margin as a fraction of ATR |
| SignalCooldown | 5 | Minimum bars between same-direction signals |
| MinConfluence | 2 | Minimum number of filters that must pass |
Signal Display
| Parameter | Default | Description |
|---|---|---|
| ShowArrows | true | Show buy/sell arrow markers on the chart |
| ShowLabels | true | Show text labels with price and confluence at signals |
Risk Management
| Parameter | Default | Description |
|---|---|---|
| ShowTPSL | true | Display TP/SL lines and fill zones on the chart |
| UseAtrSL | true | Calculate stop loss from ATR (if false, uses SlPercent) |
| AtrPeriod | 14 | Period for the ATR used in SL/TP calculations |
| SlMultiplier | 1.5 | Stop loss distance as a multiple of ATR |
| SlPercent | 1.0 | Stop loss as a percentage of entry price (when UseAtrSL = false) |
| TP1_RR | 1.0 | TP1 risk-reward ratio relative to stop loss distance |
| TP2_RR | 2.0 | TP2 risk-reward ratio relative to stop loss distance |
| TP3_RR | 3.0 | TP3 risk-reward ratio relative to stop loss distance |
TP/SL Display
| Parameter | Default | Description |
|---|---|---|
| ShowSL | true | Show the stop loss line and risk zone |
| ShowTP1 | true | Show the TP1 line and label |
| ShowTP2 | true | Show the TP2 line and label |
| ShowTP3 | true | Show the TP3 line and label |
Dashboard
| Parameter | Default | Description |
|---|---|---|
| ShowDashboard | true | Display the real-time dashboard panel |
| DashCorner | CORNER_RIGHT_UPPER | Chart corner for dashboard placement |
Alerts
| Parameter | Default | Description |
|---|---|---|
| EnableAlerts | true | Master switch for all alerts |
| AlertPopup | true | Show on-screen popup dialog |
| AlertSound | true | Play alert.wav sound file |
| AlertPush | false | Send push notification to mobile |
| AlertEmail | false | Send email notification |
Colors
| Parameter | Default | Description |
|---|---|---|
| ResistanceColor | clrTomato | Color for resistance trendlines |
| SupportColor | clrMediumAquamarine | Color for support trendlines |
| BuySignalColor | C'0,230,118' | Color for buy arrows and labels |
| SellSignalColor | C'255,23,68' | Color for sell arrows and labels |
Recommended Configuration Profiles
Conservative (fewer signals, higher quality): Set MinConfluence = 3, enable all four filters (UseAdxFilter = true), increase PivotLeftBars and PivotRightBars to 30. This configuration produces fewer signals but each one has strong multi-factor confirmation.
Default (balanced): Use all default values. Three filters enabled (EMA, RSI, Volume), MinConfluence = 2, PivotLeftBars = PivotRightBars = 20. Suitable for most Forex pairs on H1 and H4.
Aggressive (more signals, broader capture): Set MinConfluence = 1, reduce PivotLeftBars and PivotRightBars to 10, reduce SignalCooldown to 3. This produces more frequent signals with lower individual confluence but captures more breakout opportunities.
Installation
Apex Break PRO is distributed through the MQL5.com Market and installs automatically after purchase.
- Purchase the indicator from the MQL5.com Market product page.
- The indicator downloads and installs automatically into MetaTrader.
- Open the Navigator panel (Ctrl+N) and expand the Indicators section.
- Find Apex Break PRO under Indicators > Market.
- Drag the indicator onto any chart.
- Adjust input parameters if needed, then click OK.
The indicator works on all timeframes and all instruments supported by your broker. No manual file copying is required.
For best results, allow the indicator a few moments to load its historical trendline calculations the first time it is applied to a chart. The warmup period depends on the EMA length and pivot detection parameters, but is typically around 250 bars. After the initial calculation, subsequent ticks process incrementally with no noticeable delay.
Ensure that the chart has sufficient historical data loaded. The indicator requires at least the warmup period plus additional bars for pivot detection. If your chart shows fewer than 500 bars, consider scrolling back or increasing the Max Bars in Chart setting in MetaTrader's Options menu. This ensures that trendlines are calculated from a representative sample of market structure.
The indicator uses approximately 4 indicator buffers and creates graphical objects for trendlines, TP/SL zones, signal labels, and the dashboard. All objects use the prefix "ABP_" and are automatically cleaned up when the indicator is removed from the chart.
Product Links
Conclusion
Apex Break PRO replaces manual trendline drawing with an automated, rule-based system that identifies pivot highs and lows, constructs sloped trendlines, detects breakouts on confirmed bar closes, and validates each signal through a multi-filter confluence scoring framework. By automating what is traditionally one of the most subjective tasks in technical analysis, the indicator removes inconsistency and allows traders to approach trendline breakouts with a repeatable process.
The ATR-based risk management module provides predefined stop loss and three take profit levels for every signal, eliminating the need for manual calculation. The real-time dashboard and six-condition alert system keep traders informed without requiring constant chart monitoring. Together, these components form a complete signal-to-management workflow within a single indicator.
The indicator is designed for traders who want a structured, repeatable approach to trendline breakout trading across Forex, Crypto, Stocks, Commodities, and Indices. It performs well on the 15-minute, 1-hour, and 4-hour timeframes for swing entries, though it adapts to any timeframe through its ATR-based calculations.
All 34 input parameters are fully configurable, allowing the indicator to be tuned from conservative setups with strict confluence requirements to aggressive configurations that fire on any trendline break with minimal filtering. Whether used as a primary signal source or as a confirmation tool alongside other analysis methods, the systematic approach to trendline detection and breakout validation provides a foundation for disciplined, rule-based trading.
Risk Disclaimer. Trading financial instruments carries a high level of risk and may not be suitable for all investors. Past indicator signals do not guarantee future results. The information provided in this article and by the indicator is for educational and informational purposes only and should not be construed as investment advice. No indicator can predict future price movements with certainty, and all trading involves the risk of loss. Always use proper risk management, position sizing appropriate to your account, and never risk more than you can afford to lose. Consult a qualified financial advisor before making trading decisions. Test any new indicator thoroughly on a demo account before applying it to live trading.
CONTACT & SUPPORT
- Email: info@forexobroker.com
-
✅ All MQL Tools: https://www.mql5.com/en/users/forexobroker/ ✅
--------------------------------------------------------------------------------------------------------------
🏦 **Broker I use**: https://icmarkets.com/?camp=55869
🏦 **Broker For EU Traders I use 1**: https://www.ictrading.com?camp=91414
🏦 **Broker I use 2**: https://one.exnessonelink.com/boarding/sign-up/a/c_thuv62ocfq
💻 **VPS**: https://chocoping.com/processing/aff.php?aff=738
💼 **Companies I use for getting funded**:
Fundednext: https://fundednext.com/?fpr=kestutis39
The5ers: https://www.the5ers.com/?afmc=16kl
FTMO: https://trader.ftmo.com/?affiliates=nRAyOhmFRnEnFdOpdLeh


")
")
")