
Mastering XAUUSD Daily: What Smart Traders Are Watching Today, January 6,2026

A good strategy makes money; discipline keeps it.
Happy New Year, traders! What can we anticipate from this year's gold market? We'll examine what the chart actually conveys today, including where buyers and sellers are active, which levels are crucial, and how momentum is shifting in real time.
Before we begin, I would like to share with you the best ways to use MQL4 and MQL5 to transform your trading strategies into extremely profitable machines. In order to teach traders how to construct MT4 and MT5 trading algorithms from the bottom up, I have created basic instructions.
📘LEARN HOW TO DEVELOP THE PERFECT TRADING ALGORITHM FOR MT4
📘LEARN HOW TO DEVELOP THE PERFECT TRADING ALGORITHM FOR MT5
A powerful system/ trader assistant tool designed to enhance analysis, improve timing, and give traders a structured approach to market execution.
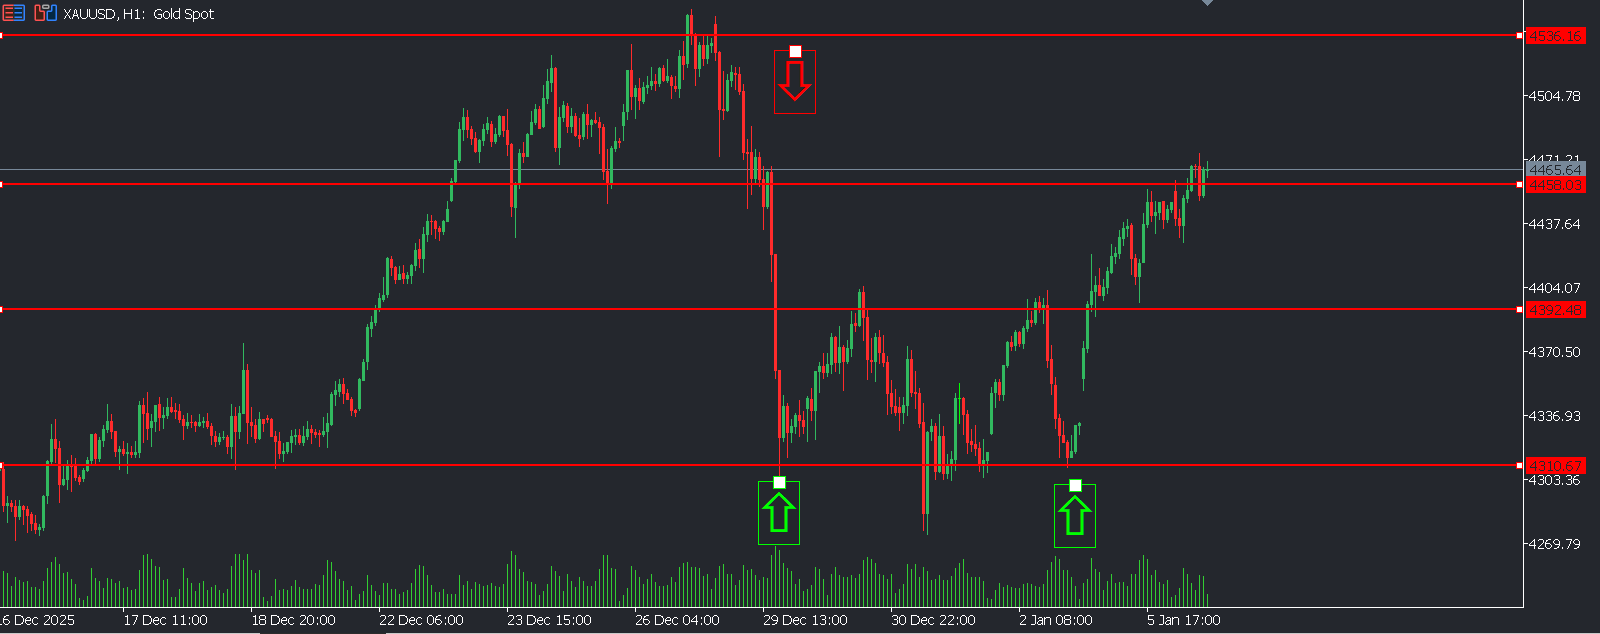
📊 XAU/USD Intraday Technical Analysis – 6 January 2026 H1 & M15 Outlook | Gold reacts as full liquidity returns to the market
As the market settles into the first full trading week of January, XAU/USD (Gold) begins to transition out of the thin, erratic year-end conditions and into a more structured, participation-driven environment. With institutional traders back at their desks, price action on 6 January 2026 is expected to show cleaner respect for key levels, stronger follow-through, and more reliable intraday setups.
This shift favors traders who combine higher-timeframe context (H1) with precise execution (M15).
⏱️ H1 Timeframe Analysis – Structure & Directional Bias
🔹 Market Structure
On the H1 chart, gold is attempting to establish directional intent after several sessions of consolidation. Price action suggests that the market is building a base, with higher lows forming and sellers failing to push price meaningfully below recent support.
This behavior signals accumulation and positioning, rather than random rotation.
➡️ H1 Bias: Neutral → Bullish
➡️ Market State: Transition from range to expansion
📌 Key H1 Levels
🟢 H1 Support Zones
-
Primary Support: 4,320 – 4,300
-
Structural Support: 4,270 (loss of this level weakens bullish structure)
🔴 H1 Resistance Zones
-
Immediate Resistance: 4,360 – 4,370
-
Expansion Level: 4,400 – 4,420 (momentum confirmation zone)
A sustained H1 close above 4,370 would confirm bullish continuation potential, while failure to hold above 4,300 would signal a return to balance.
📊 H1 Indicators
-
RSI: Recovering above 50 → improving bullish momentum
-
50-period MA: Price holding above → structural support
-
MACD: Turning positive → momentum shift emerging
⏱️ M15 Timeframe Analysis – Execution & Order Flow
🔹 Short-Term Price Action
On the M15 timeframe, price action becomes more purposeful and directional, with:
-
cleaner impulses
-
shallower pullbacks
-
clearer higher-low and lower-high sequences
This reflects real participation and execution by larger players, making M15 ideal for entry confirmation.
➡️ M15 Bias: Direction-dependent on H1
➡️ Best Use: Timing entries after pullbacks
📌 Key M15 Levels
🟢 M15 Support
-
4,335 – 4,325: Intraday demand and pullback buy zone
-
4,310: Breakdown trigger if lost with momentum
🔴 M15 Resistance
-
4,360 – 4,365: Intraday supply and reaction zone
-
4,385: Liquidity high and breakout trigger
🧠 Price Action & Liquidity Context
With liquidity returning:
-
breakouts are more likely to follow through
-
fake moves are reduced but still possible near session opens
-
New York and London overlaps carry the highest execution quality
Traders should still wait for confirmation, but can expect better reward-to-risk conditions compared to late December.
🔍 Intraday Trading Scenarios – 6 January 2026
📈 Bullish Scenario (Preferred if H1 Holds)
-
Trigger: H1 acceptance above 4,370
-
Targets: 4,400 → 4,420
-
Execution: M15 higher-low pullbacks into demand
📉 Bearish Scenario
-
Trigger: Strong M15 breakdown below 4,310 with H1 follow-through
-
Targets: 4,300 → 4,270
-
Execution: Sell retests into broken support
🔄 Consolidation Scenario
-
Range: 4,325 – 4,365
-
Strategy: Short-term mean reversion with tight risk
-
Note: Expect compression before expansion
🏁 Intraday Outlook & Trading Plan
For 6 January 2026, XAU/USD on H1 and M15 presents higher-quality intraday opportunities as structured liquidity returns to the market. This environment favors:
-
trend-aligned entries
-
patience during pullbacks
-
disciplined risk control
👉 The best trades will come from aligning H1 directional bias with clean M15 confirmations — not from over-trading early volatility.
If momentum confirms, gold may begin setting the tone for January’s broader directional move, making today a key session to observe acceptance, rejection, and follow-through.


 Trading Guide")
