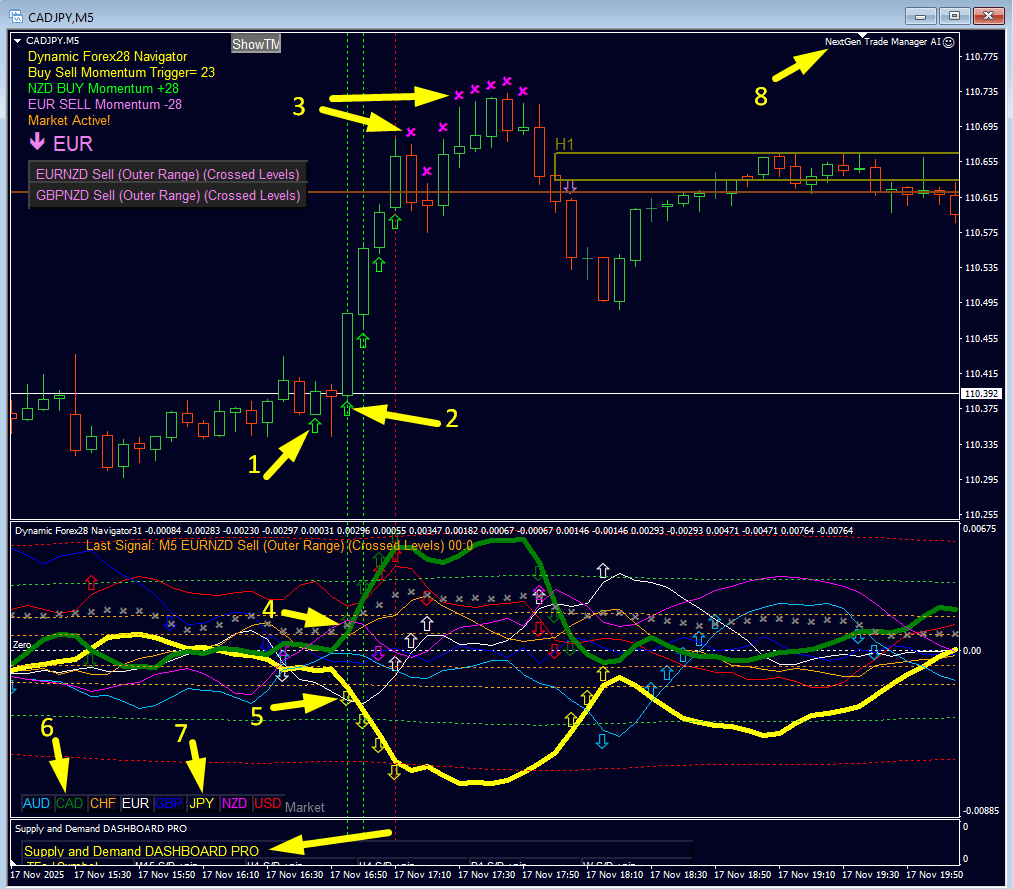
Each numbered arrow marks a key element of the setup.
1) Early Movement – First Momentum Build-Up
The first upward movement appears as CAD begins to strengthen and JPY weakens.
This is the early signal that a breakout or trend may be forming.
2) M5 Momentum Trigger – BUY Signal Confirmed
A Buy Momentum Trigger is fired on the Navigator.
This confirms synchronized Currency Strength + Momentum (Speed)—a validated entry signal.
3) Recent Supply Zone + X-Markers (Exit Area)
Price reaches a recent supply zone, and purple X-markers appear.
These signal:
- a potential exit zone
- price exhaustion
- no further entries at this point
This is a clear warning that bullish momentum is slowing.
4) Strong CAD Strength Increase
The CAD line (green) surges upward, breaking multiple levels.
This shows:
- strong CAD momentum
- clean trend confirmation
- strong/weak separation vs. JPY
Perfect conditions for a BUY scenario.
5) JPY Weakness Growing
JPY continues to fall deeper into negative levels.
This indicates:
- increasing weakness
- stable downtrend
- no signs of reversal
Ideal pairing: strong CAD vs. weak JPY.
6) + 7) Currency Color Legend
This displays the color coding of all eight currencies.
Essential for quick line identification on the Navigator.
Click two to change the pair.
8) NextGen Trade Manager AI
The trade is managed automatically by the NextGen Trade Manager AI, which handles:
- SL placement
- TP placement
- trailing stop
- risk and position management
Ensures consistent and safe trade execution.
Bottom Arrow (No Number) – Supply and Demand Dashboard PRO Heads-Up
This arrow highlights the Supply and Demand Dashboard PRO, which provides alerts for supply and demand zones across all timeframes.
Use this information to:
- avoid trading against strong supply/demand
- set Take Profit (TP) targets
- set Stop Loss (SL) safely
- confirm market structure before entering a trade
Summary – What This Setup Shows
- Perfect alignment of Momentum, Currency Strength, and Supply/Demand
- Confirmed entry via Momentum Trigger
- Strong CAD vs. weak JPY trend
- Clear exit zone marked by supply + X-markers
- Higher-timeframe protection using SD Dashboard PRO
- Smart SL/TP management by Trade Manager AI
A clean and textbook example of a high-probability Dynamic Forex28 Navigator trade.
Dynamic Forex28 Navigator https://www.mql5.com/en/market/product/122172
Supply and Demand DASHBOARD PRO https://www.mql5.com/en/market/product/37335
NextGen Trade Manager AI https://www.mql5.com/en/market/product/149255
Happy trading, best regards Bernhard
https://www.CurrencyStrength28.com


