
Alternative approaches to trend interpretation for the FourAverage indicator

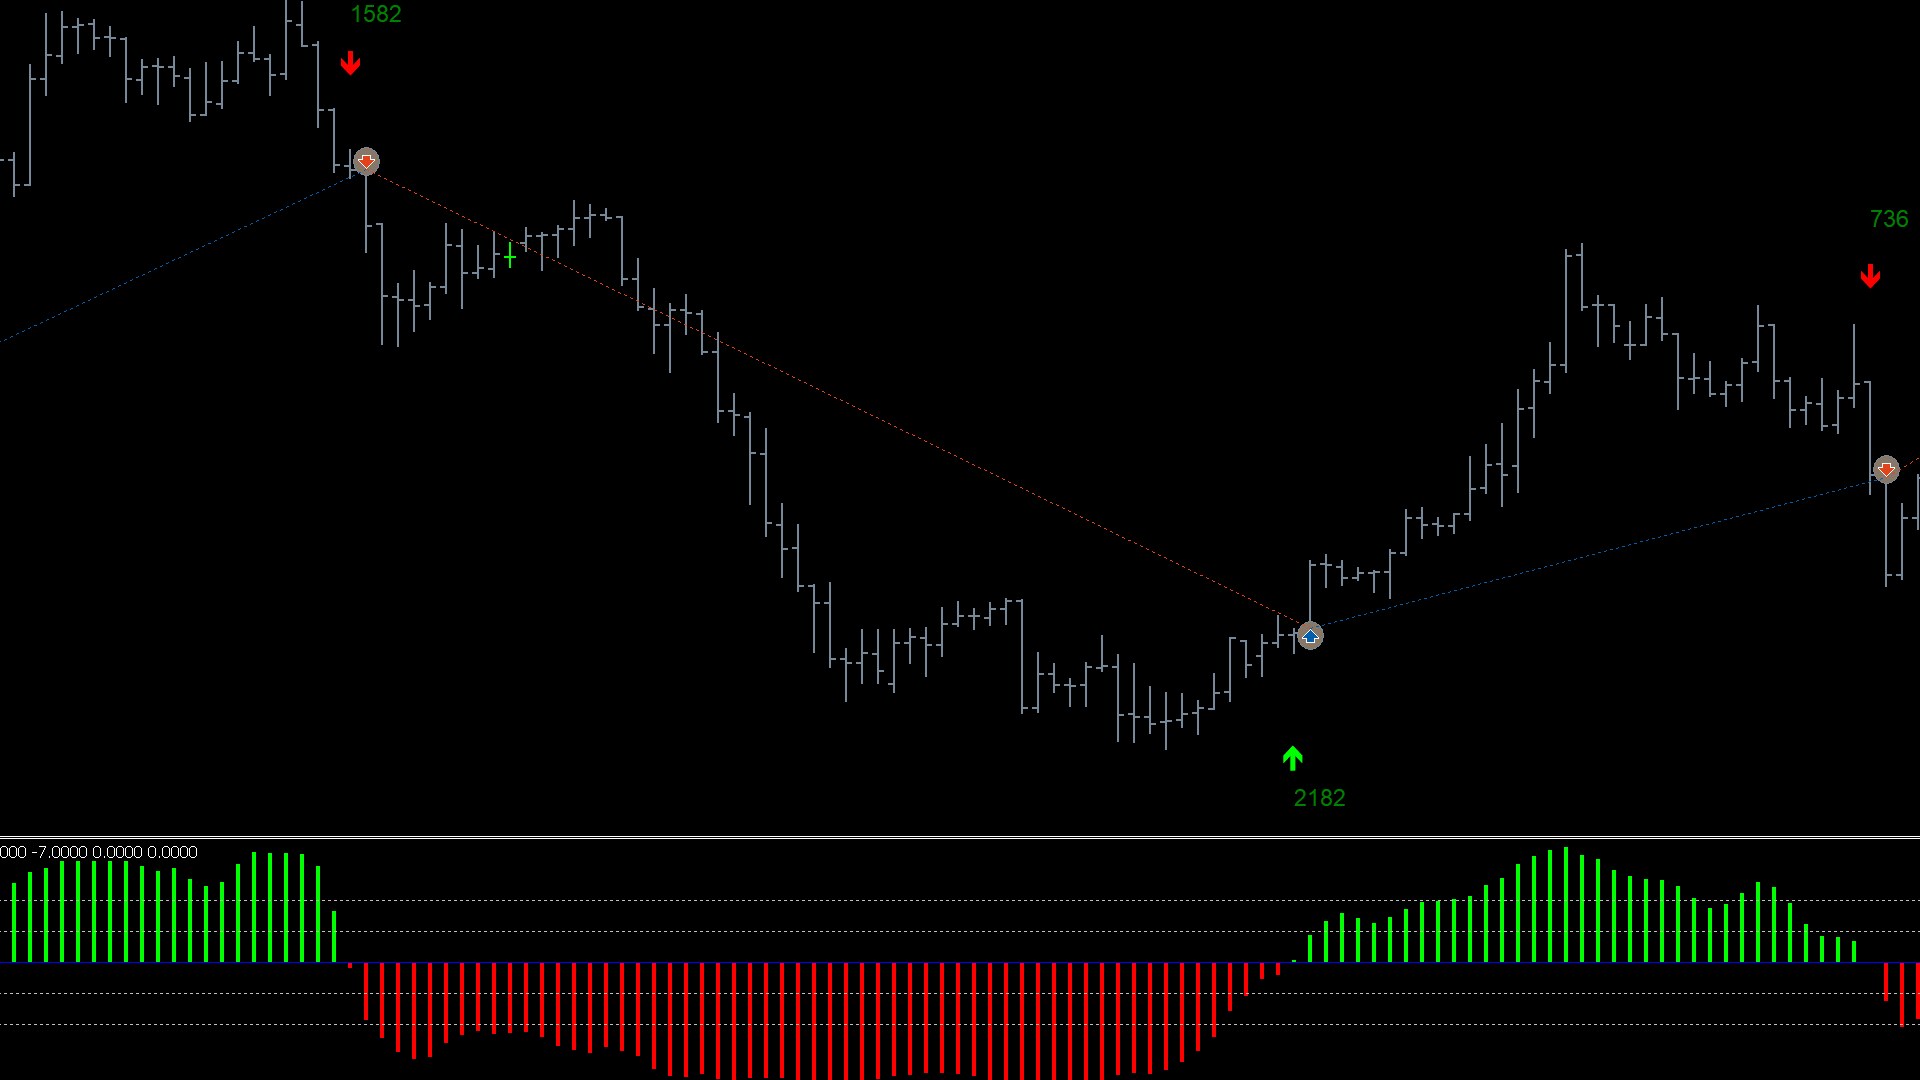
In the process of preparing for the tests, it was decided to look for alternative ways of interpreting the trend... As a result, we decided to interpret the upward trend only after breaking through a certain level above zero, and the downward trend after breaking through the lower level. In the figure below, the color scheme of the indicator symbolizes the trend, and the levels are values of 60 and -1.
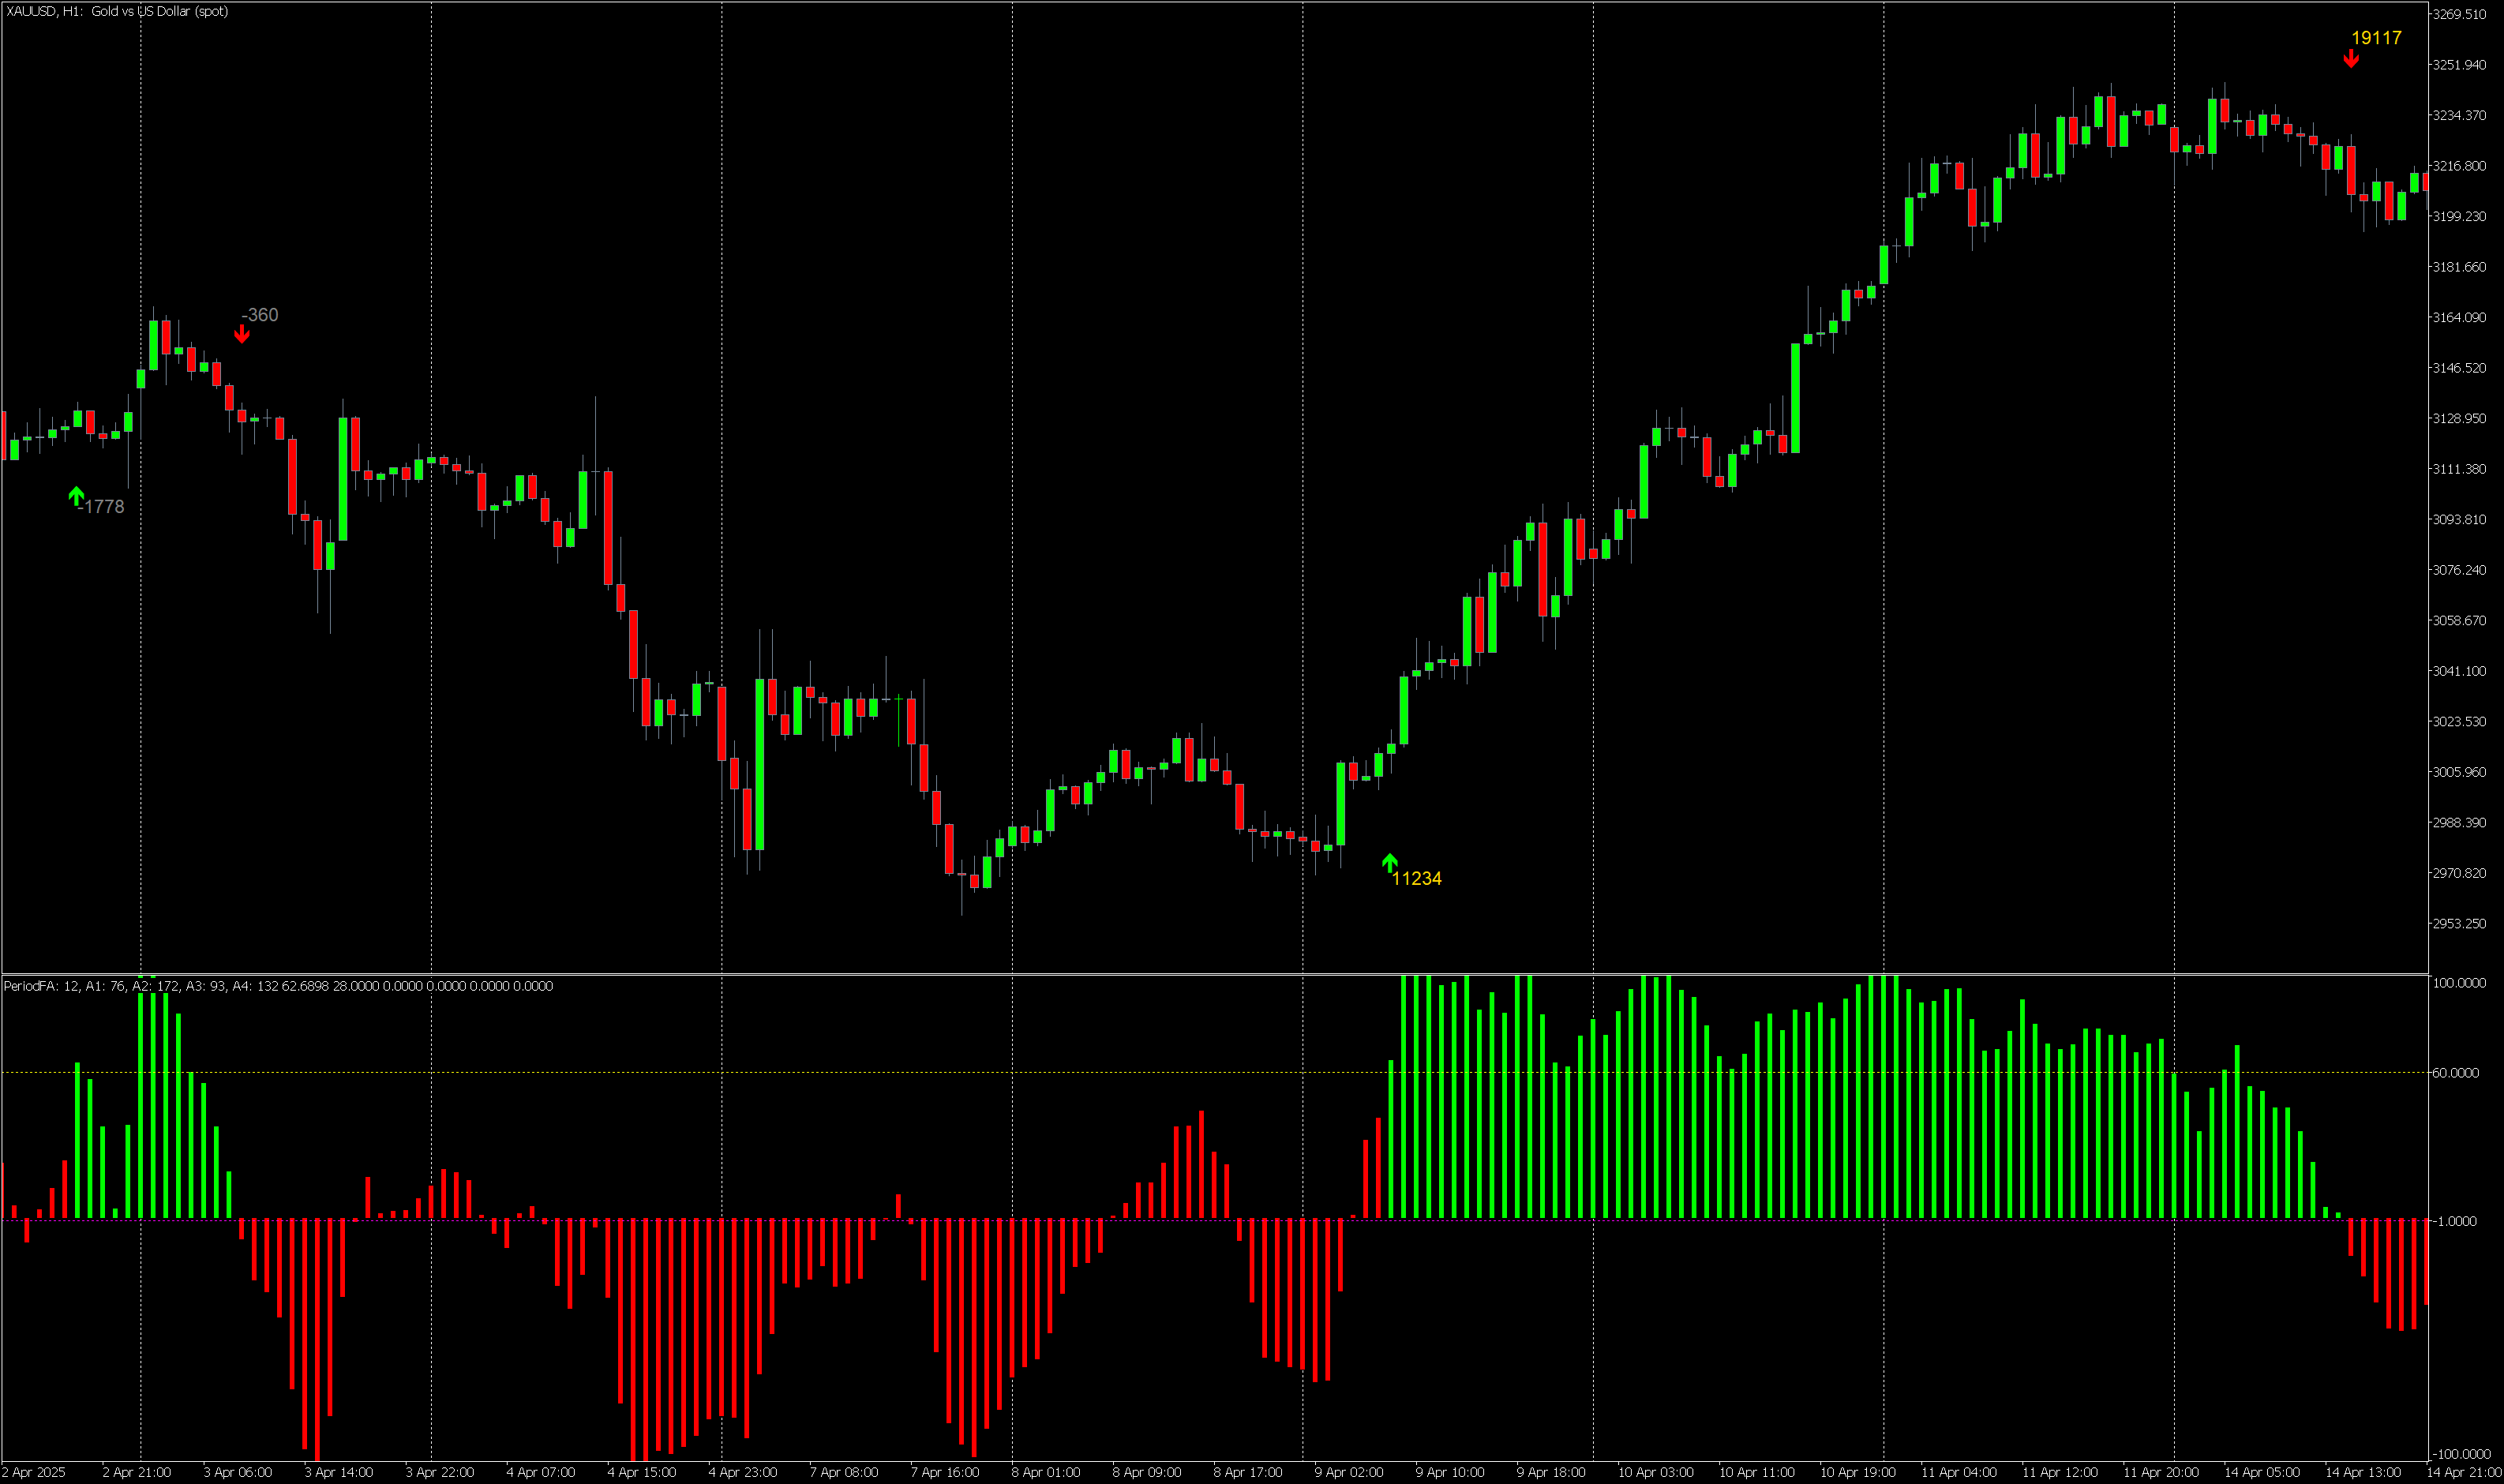
As a result, we were able to significantly improve the result. Look at the test result for Gold 2012-2025. The red lines mark the periods of forward tests (new data that was not taken into account when selecting parameters).
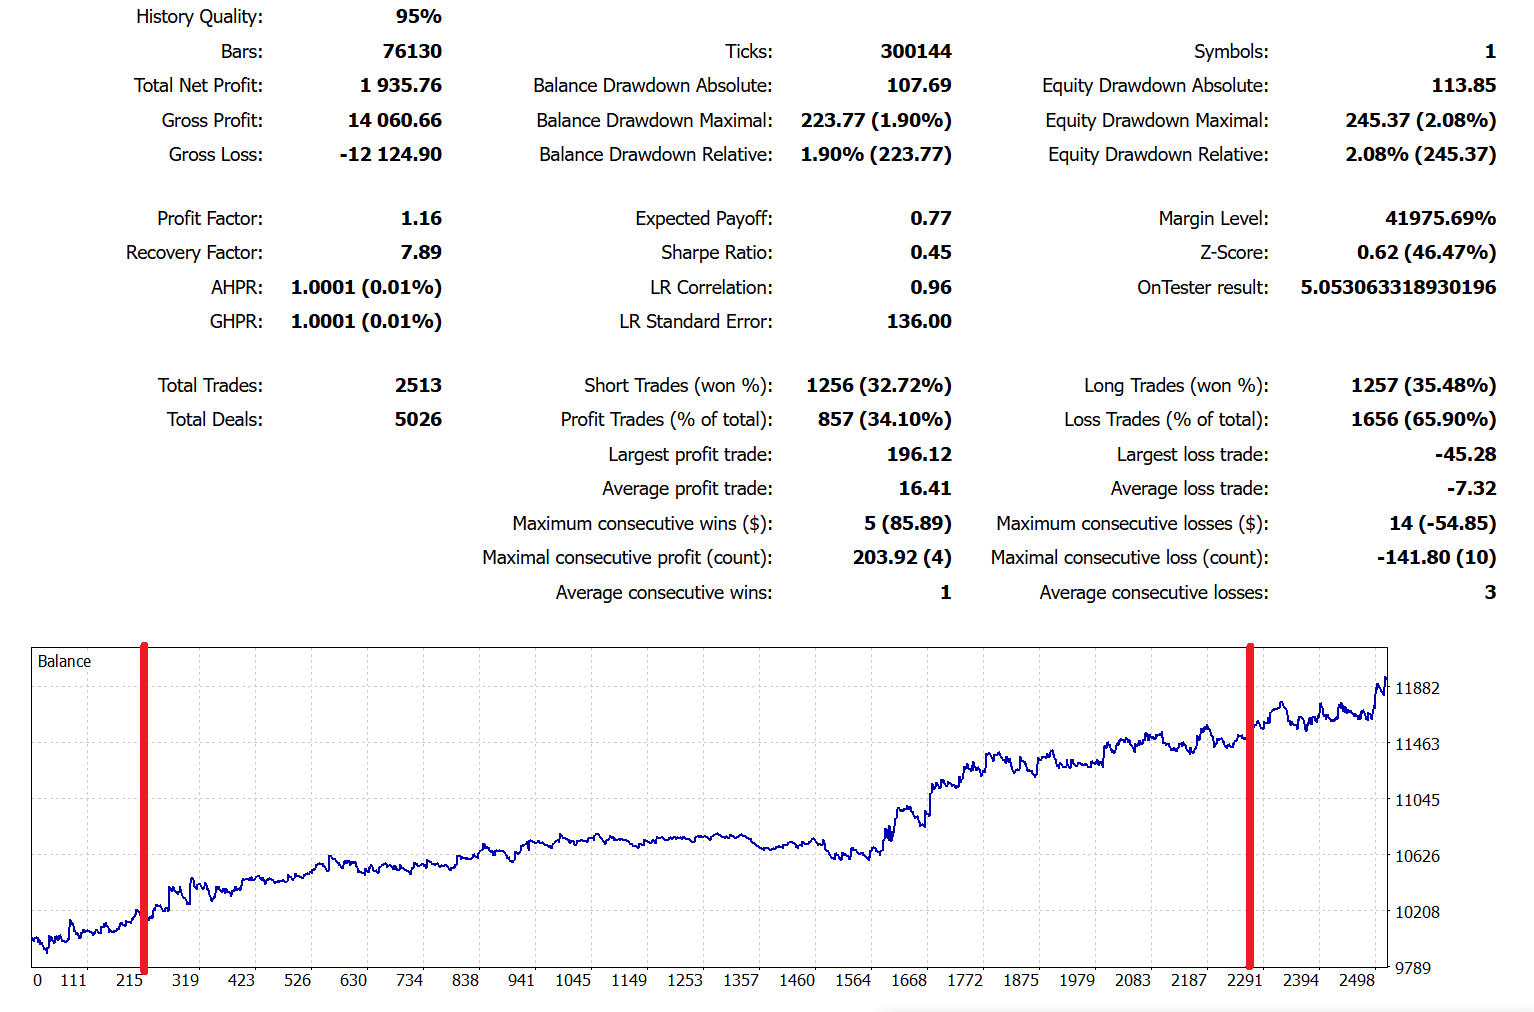
Here are the parameters that gave this result:
- PeriodFA = 10;
- Average_1 = 112;
- Average_2 = 148;
- Average_3 = 100;
- Average_4 = 146;
- Range = 31;
- Level_UP = 60;
- Level_DN = -1;
In version FourAverage 2.6, we added these parameters to the built-in ready-made settings.
In the process of testing the FourAverage indicator, we were faced with the possibility of significantly changing its effectiveness by rethinking the approach to data interpretation. Traditionally, histogram analysis is conducted relative to the zero line, but our experience has shown that breaking through certain levels (in our case, 60 and -1) can serve as a more reliable signal to enter a position. Thus, alternative approaches to trend interpretation can significantly improve the effectiveness of using the FourAverage indicator or any other indicator. Look around, maybe it's time to take a fresh look at your favorite indicators. It is also important to remember that no indicator can guarantee absolute success, so it is important to combine its use with other methods of risk analysis and management.
Additional resources and information about the FourAverage indicator


 Terminals on One Windows PC (Complete Beginner Guide)")