

Logarithmic price charts. It doesn't sound easy. What are they? Some stocks or cryptocurrencies have risen indecent lately. It simply does not make sense to analyze their linear charts now. It's great that there is an additional tool for solving this problem.
Logarithmic price charts are used in financial analysis to represent and analyze the price movement of an asset over time. Unlike linear price charts, which have a constant scale, logarithmic price charts use a logarithmic scale for the price axis. The logarithmic scale on the price axis is particularly useful when dealing with assets that experience large price variations over time, such as stocks, cryptocurrencies, or commodities. By using a logarithmic scale, the vertical distance between two points on the chart represents the percentage change in price rather than the absolute change.
You may ask me what are the key reasons why logarithmic price charts are used? They are as follows.
Percentage changes and Smoothing price trends
Logarithmic charts make it easier to analyze and compare percentage changes in prices. This is especially valuable for long-term analysis, where small percentage changes in price can be significant. Logarithmic scales can help smooth out volatile price movements, making it easier to identify long-term trends. By compressing larger price movements and expanding smaller ones, logarithmic charts can provide a more balanced view of the overall price trajectory.
Visualizing multiplicative growth and Long-term perspective
Logarithmic charts are particularly effective for visualizing assets that have undergone exponential or multiplicative growth. Instead of appearing as steep curves on a linear chart, exponential price movements are shown as straight lines on a logarithmic chart. Logarithmic price charts are commonly used for long-term analysis, as they emphasize the percentage changes and trends over extended periods. This can help identify support and resistance levels, chart patterns, and overall market dynamics over time.
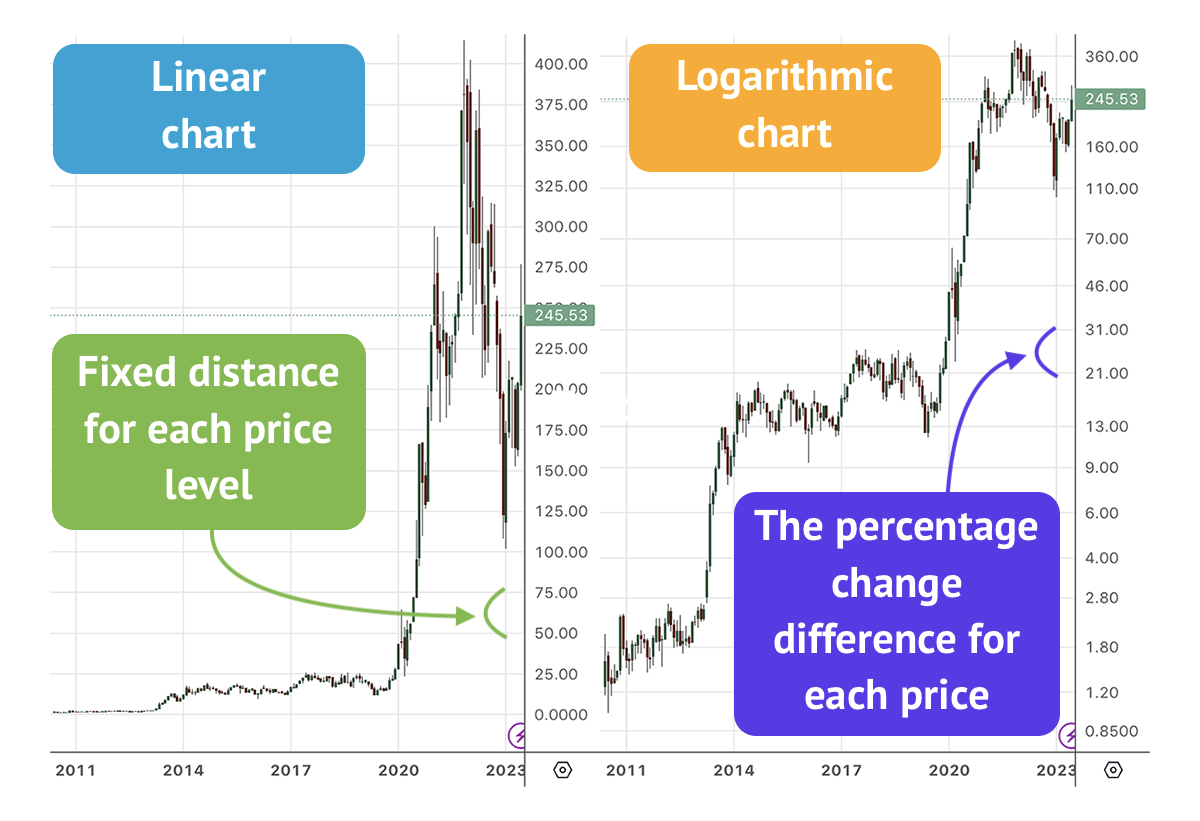
Look at the picture. Both of these charts show the same symbol and timeframe: Tesla (TSLA) since its IPO. It's completely impossible to carry out any meaningful analysis of the linear chart.
Logarithmic charts offer advantages for certain types of analysis. However, they may not be suitable for all situations. For short-term trading or precise entry/exit points, traders often switch to linear charts or employ other technical indicators in conjunction with logarithmic charts.
My solutions: Vladimir Toropov's products for traders


