SMC Trading Part 3 - No matter how varied the form, structure breaks it all

II. Fundamental Knowledge
- Structural foundation:
- Estimating direction based on structure
- No matter how varied the form, structure breaks it all
- The role of structure in trading
- Supply and demand foundation:
- Supply and demand trading strategy based on structure
No matter how varied the form, structure breaks it all
The key to simplifying technical patterns
In technical analysis, chart patterns play a significant role, and traders use the patterns formed by price movements to predict future trends. Common patterns include head and shoulders, flags, wedges, triangles, rectangles, and others.
Drawing all kinds of technical chart patterns accurately is one of the basic skills of traditional traders. However, it is a common misconception that technical analysis is all about drawing lines, shapes, trends, supports and resistances, and turning points.
In fact, all patterns are part of the range or adjustment, which is the position that trend traders want to avoid and that range traders prefer. Market structure is a concept that is adept at dealing with oscillations, and it does not require consideration of range support and resistance levels, only waiting for it.
Traders should break down the market behavior into various patterns in the learning stage.However, when trading, it is best to reverse engineer the rules and achieve a unification of various patterns to make quick decisions. It is like the butcher who can carve up an ox no matter how it is shaped. Novice traders do not need to memorize and draw chart patterns themselves.
This article shares the use of two reversal structures [1] to deal with various technical patterns. The market structure is composed of various reversal points, i.e., wave points/tops and bottoms. Reversal has two basic structures: structure break and confirmation of higher/lower points.
The two reversal structures are separated for better learning, but they need to be unified when applied. Upon careful observation, it can be seen that there is only one reversal structure, which is the common point of the two basic structures - structural breakthrough.
The real Holy Grail for traders
Breakouts are manifested microscopically as engulfing patterns and consecutive candlesticks, and macroscopically as structural breakouts and trends. Breakouts represent strength, and can be seen as funds winning the game or prices becoming unbalanced. These all mean the same thing, and personally, I prefer to use the concept of imbalance.
Effectively identifying and trading the imbalanced points in market structure is the key ability to profit in random markets and the real Holy Grail for traders to gain an advantage.
The path to trading is vast and varied. What I am sharing is just one perspective, and I only have the experience of a first-year trading student. However, using other methods did not yield profits for me, and it was structure that led me to truly step into the trading threshold and catch a glimpse of the magnificent hall of price behavior. Hopefully, through this article, I can inspire those wandering outside the trading threshold to find a direction forward.
How to trade patterns with structure
Market structure cannot be predicted, and requires waiting for prices to move, and then following the strength. However, traders can also discover strong imbalances in pattern ranges ahead of time through observation and training, which falls within the realm of personal ability and will not be discussed further in this article.
From a structural perspective, the processing method for flag patterns, rectangular patterns, and wedge patterns is the same. There are three variations of triangle patterns, two of which, symmetrical triangles and ascending/descending triangles, are similar to flag patterns. Only expanding triangles and diamonds require examples to explain. There are two variations of head and shoulder patterns, one being a standard head and shoulders, and the other being the same as double tops/bottoms.
Flags/Rectangles/Wedge/Symmetric Triangles
Traditional analysis uses trendlines or channels to judge, but mischievous candlesticks always cross trendlines, so the rule is added to ignore shadows and only draw trendlines/channels based on closing prices.
When using structural trading, the main focus is on whether prices break through the previous structure. For example, on the right side of the figure below, the red solid line breaks through the previous high and forms a higher high point, which can be considered as an entry point at the red circle.
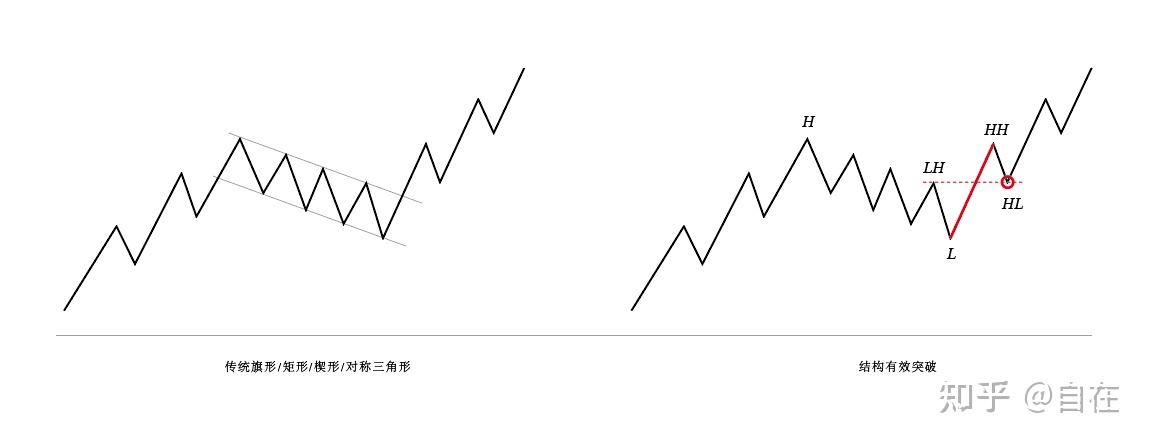
I must point out two things: 1. Entering the market at the HL point in the red circle is a risky entry. It is more likely to wait for a break above HH and then enter on a pullback. 2. After the red line breaks, the pullback may not necessarily retest the structure exactly, it may pull back deeper or shallower, but as long as a subsequent low is formed, it is considered valid.
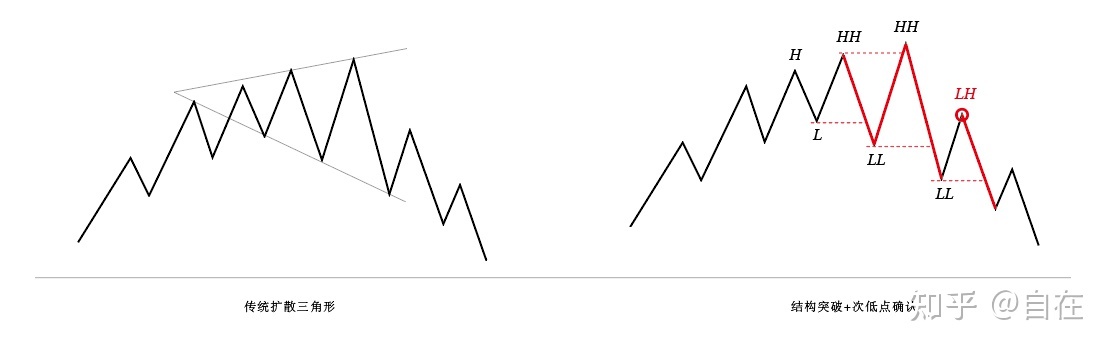
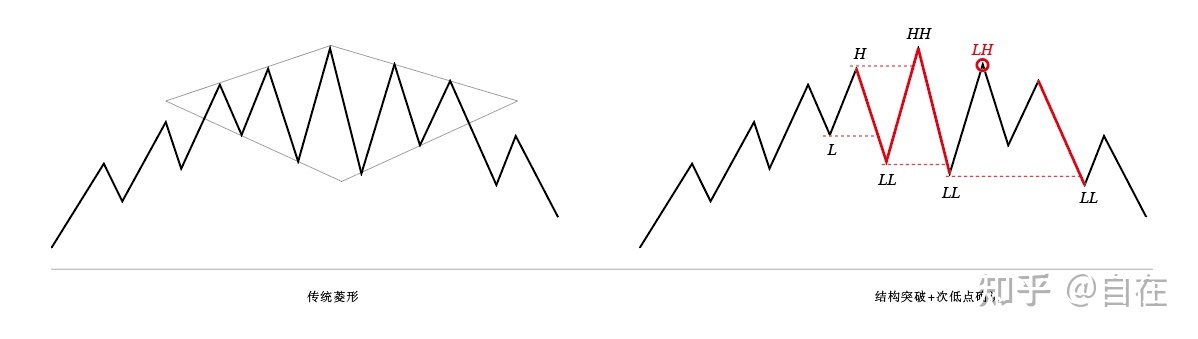
Broadening triangles/diamonds
Broadening triangles/diamonds may break out in both directions and require confirmation of a subsequent high or low before trading. In the example on the right in the figure below, a subsequent high is confirmed at the red circle (confirmed through structural breakout), indicating the direction of the market.
Head and shoulders patterns/double tops and bottoms
Reference:
- ^ "How to catch tops and bottoms: an introduction to market structure" SMC Trading Part 2 - Trading Systems - 10 April 2023 - Traders' Blogs (mql5.com)
- ^ "Variations" refers to the different handling methods during the formation of the pattern.


")
![[XAUUSD]: Weekly Liquidity Activation Points (timings), June 22-26, 2026](https://c.mql5.com/6/1013/splash-preview-771790.png "[XAUUSD]: Weekly Liquidity Activation Points (timings), June 22-26, 2026")
")