
II. Fundamental Knowledge
- Structural foundation:
- Estimating direction based on structure
- No matter how varied the form, structure breaks it all
- The role of structure in trading
- Supply and demand foundation:
- Supply and demand trading strategy based on structure
Estimating direction based on structure
Buying low and selling high versus following the trend: which one is correct?
Some experts say that the majority of their profits come from buying low and selling high, while others claim that following the trend is the only way to profit. Who is correct? From the perspective of these experts, both approaches are correct because they have their own trading logic and system to prove their point.
So who is wrong? The followers who blindly follow these experts without considering their own trading strategy.
No one can completely and logically interpret the market with a single approach. Therefore, any internally consistent market view is feasible. We should not let external biases influence our decision-making and hinder our ability to accept and reflect on different opinions, or it will create barriers to understanding.
What do traders need?
Just as a boat is needed to cross a river and a rope is needed to climb a mountain, whether traders want to buy low and sell high or follow the trend, they need appropriate tools and training to master their use.
Before choosing a trading tool, it is important to compare and research until finding one that suits you. Once you have chosen a tool, you must trust it firmly, as wavering between decisions will only result in losses.
Is picking tops and bottoms gambling or predicting the market?
Picking tops and bottoms belongs to the category of swing trading, which goes against the trend of the current cycle but is completely with the trend of the larger cycle (multi-periodicity is beyond the scope of this article).
Directly entering the market at a key point of the larger cycle is risky, so it is safer to wait until the market forms a higher high/low point before entering. Many times, the higher high/low point occurs in a deep retracement position, where the risk-to-reward ratio is similar to that of picking tops and bottoms, but the safety factor is higher.
To understand how to catch the higher high/low point, it is best to understand market structure.
What is market structure?
To judge the direction of the market, no indicators are needed, only whether the price breaks through in the same direction continuously.
For example, when the price breaks through the previous high and then retraces, the expectation is for a higher high/low point (HL) to form and then continue to break upwards. The same principle applies to a downtrend.
The breakthrough-retracement-breakthrough structure forms the basic structure of the market[1]. According to Dow Theory, the market structure can be simplified into the following three theoretical models[2]:
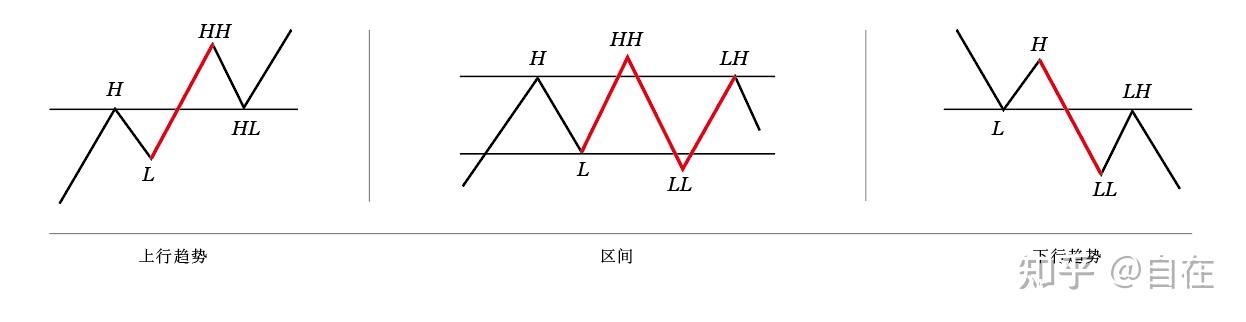
HH=Higher High, HL=Higher Low; LH=Lower High, LL=Lower Low
Uptrend: The price breaks through the previous high (marked by a red line) to form a HH, retraces without breaking the previous low, and then continues to break upwards to form an HL.
Range-bound: The price does not have a clear directional expectation.
Downtrend: The price breaks through the previous low to form a LL, retraces without breaking the previous high, and then continues to break downwards to form a LH.
Let's delve a little deeper and look at the connecting part of the two trend movements - the retracement:
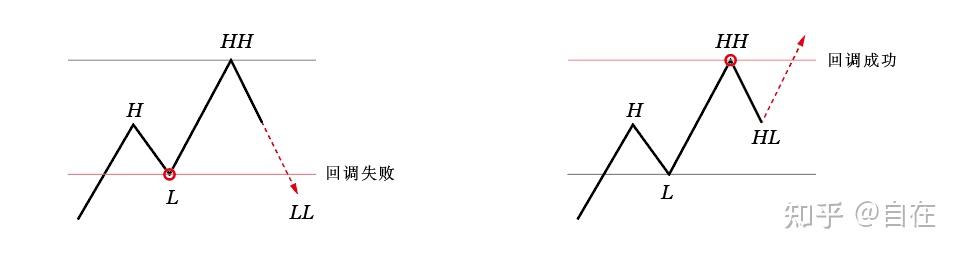
Retracement failure model:
Regardless of whether you choose to trade breakouts or retracements, you should understand the corresponding failure patterns as complements. For example, if you want to trade breakouts, you need to understand breakout failures, and if you want to trade retracements, you need to be familiar with retracement failures.
If the retracement is successful, the existing trend will continue. If the retracement fails, the trend will stall or reverse. However, retracement failure does not necessarily mean that the trend will immediately reverse. Multiple conditions need to be combined to confirm a reversal.
If you want to trade tops and bottoms, you need to observe the cases of retracement failure more. Take the Wyckoff model as an example, please carefully observe the retracement failure in it:
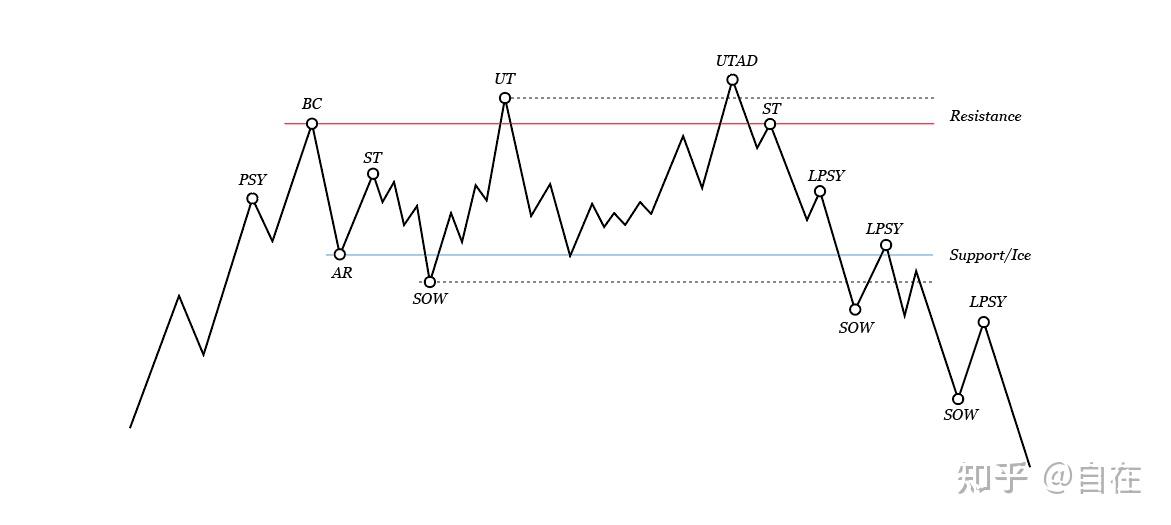
Retracement failure is a signal that may indicate a reversal of fund flows, or it may be to sweep out stop-losses or capture liquidity. If it is the former, the trend may reverse or may show a larger retracement; the latter may quickly recover the trend, or may reverse again after the breakout to capture the liquidity of both long and short positions.
If you understand the content of retracement failure above, we will continue to discuss further.
What is a reversal structure?
Learning to effectively identify reversal structures is one of the prerequisites for capturing tops and bottoms (retracement failure is a prerequisite for reversal structures).
Reversal structures mainly have two forms:
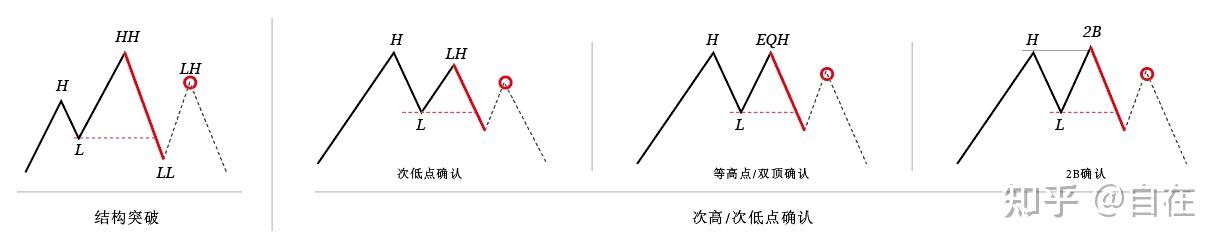
- Structure breakout (retracement failure)
- Confirmation of secondary high/low points (including double tops/bottoms and shadow false breakouts)
Price breaking in the direction of the trend is called a trend, is breaking against the trend a reversal? Please consider the similarities and differences between the two reversal structures in light of retracement failure.
Structure breakout
At the micro level, there are three main situations of price breaking structure, all of which can be considered as valid breakouts, but I prefer the latter two:
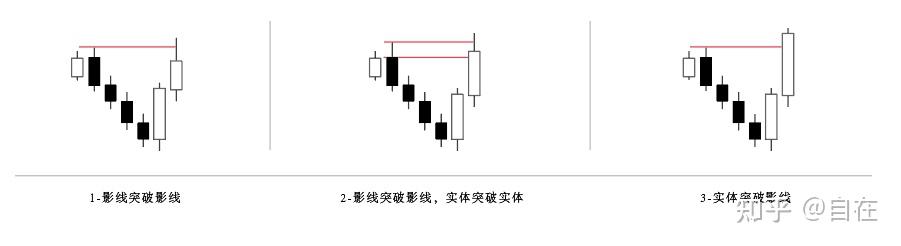
Please consider the momentum and think about which breakout is stronger? [3]
After-class reflection:
Why do technical books (especially stock market books) like to spend a lot of time telling candlestick stories based on price charts?
Is "Japanese Candlestick Charting Techniques" really suitable for beginners? Can one get started by memorizing 100 candlestick combinations?
Reference:
- ^That is, the N-shaped structure. In addition, there are many concepts of technical analysis, which, like human language, will have different names, but all refer to the same content. I will try to use common vocabulary to avoid increasing the understanding cost.
- ^It is called a theoretical model because actual trends are rarely so simple. Simplification is for the purpose of facilitating understanding, please pay attention to the differences between theory and reality.
- ^Not all weak breakouts are ineffective, they are all valid breakouts and can be selected according to personal preferences to filter the market.


")

")