
EVERYTHING ABOUT ZIG-ZAG INDICATOR IN FINANCIAL MARKETS WITH READY PUBLISHED EA

ZigZag Advanced:
https://www.mql5.com/en/market/product/90750?source=Site+Profile+Seller
ZigZag Simple:
https://www.mql5.com/en/market/product/90998?source=Site+Profile+Seller
-----
What are the differences between the ZigZag Advanced & ZigZag Simple?
1- The price is the 1st difference. So, the Simple version is lower cost than Advanced version. Why?
2- ZigZag Simple has only the standard trading strategy while the ZigZag Advanced version has more to do.
3- ZigZag Advanced will be updated in the future while the Simple version will be kept as it is.
The ZigZag indicator works by looking for price swings or waves in the chart, and it connects the high and low points of these swings with straight lines. The indicator then draws a zigzag line connecting these high and low points, which shows the overall trend direction of the market.
Traders can use the ZigZag indicator to identify support and resistance levels, as well as to determine potential entry and exit points for their trades. It is important to note that the ZigZag indicator should be used in conjunction with other technical indicators and analysis techniques to make informed trading decisions.
![]()
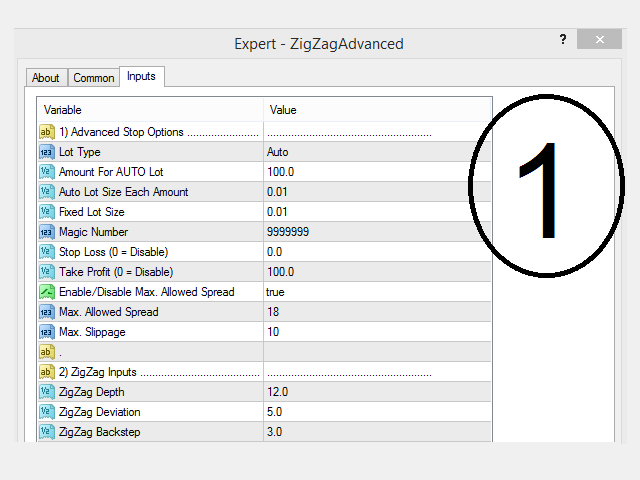
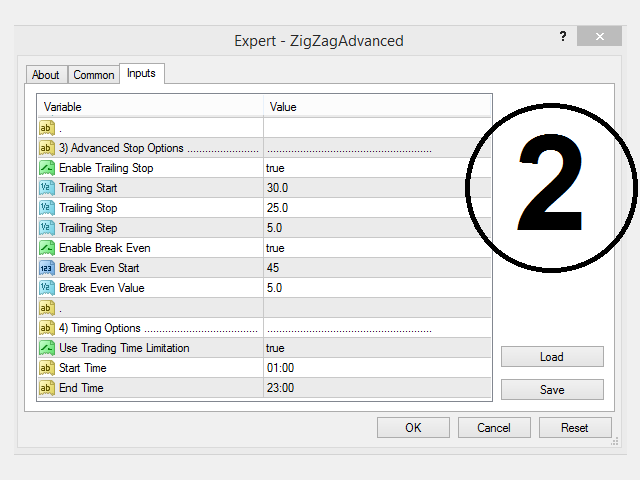
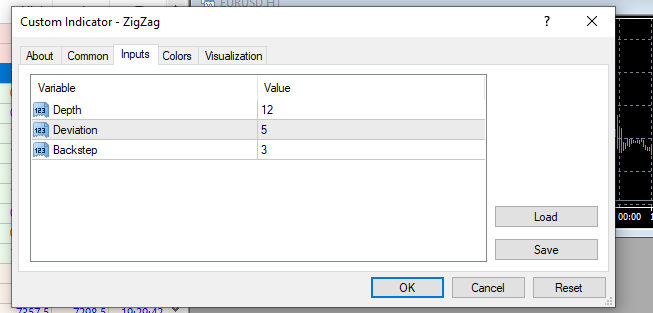
Which parameters/inputs ZigZag indicator contains?
The ZigZag indicator has two main parameters or inputs:
-
Percentage or Price deviation: This parameter specifies the minimum percentage or price movement required for the indicator to draw a new line or swing. For example, if the percentage deviation is set to 5%, the indicator will only draw a new line if the price moves up or down by at least 5%.
-
Depth: This parameter specifies the minimum number of bars or candles required to form a swing. For example, if the depth is set to 10, the indicator will only draw a new line if there have been at least 10 bars or candles since the last swing.
-
Backstep: This parameter specifies the number of bars or candles that must pass before the indicator can change direction and draw a new line or swing.
The values of these parameters can be adjusted based on the trader's preference and the characteristics of the market being analyzed. A higher percentage or price deviation will result in fewer swings being drawn, while a lower deviation will result in more swings being drawn. Similarly, a higher depth value will result in fewer swings being drawn, while a lower depth value will result in more swings being drawn.
What is the parameter "Depth" with equation and example?
The "depth" parameter in the ZigZag indicator refers to the minimum number of bars or candles required to form a swing. The equation to calculate the depth is simply the number of bars or candles required to form a swing.
For example, if the depth is set to 10, then the ZigZag indicator will only draw a new line or swing if there have been at least 10 bars or candles since the last swing. If the price moves up or down by less than the specified percentage or price deviation within 10 bars or candles, then the indicator will not draw a new line.
In other words, the depth parameter helps to filter out minor price fluctuations and noise, and only draws new swings when the price has moved significantly over a certain period of time.
It is important to note that the optimal value for the depth parameter can vary depending on the market being analyzed, the trading strategy being employed, and the time frame being used. Some traders may prefer a larger depth parameter for longer-term analysis, while others may prefer a smaller depth parameter for shorter-term analysis.
ZigZag Advanced:
https://www.mql5.com/en/market/product/90750?source=Site+Profile+Seller
ZigZag Simple:
https://www.mql5.com/en/market/product/90998?source=Site+Profile+Seller
What is the parameter "Deviation" with equation and example?
The "deviation" parameter in the ZigZag indicator refers to the minimum percentage or price movement required for the indicator to draw a new line or swing. The equation to calculate the deviation is:
Deviation = (Minimum Price Movement / Current Price) x 100
For example, if the minimum price movement is set to 10 pips and the current price is 1.2000, then the deviation would be:
Deviation = (10 / 1.2000) x 100 = 0.83%
This means that the ZigZag indicator will only draw a new line or swing if the price moves up or down by at least 0.83% from the last swing point.
The deviation parameter helps to filter out minor price fluctuations and noise, and only draws new swings when the price has moved a certain amount. This can help traders identify the overall direction of the trend and potential reversal points.
It's important to note that the optimal value for the deviation parameter can vary depending on the market being analyzed, the trading strategy being employed, and the time frame being used. Traders should experiment with different values to find the setting that works best for their specific needs.
ZigZag Advanced:
https://www.mql5.com/en/market/product/90750?source=Site+Profile+Seller
ZigZag Simple:
https://www.mql5.com/en/market/product/90998?source=Site+Profile+Seller
What is the parameter "Backstep" with equation and example?
The "backstep" parameter in the ZigZag indicator refers to the number of bars or candles that must pass before the indicator can change direction and draw a new line or swing. The equation to calculate the backstep is simply the number of bars or candles required to pass before the indicator can change direction.
For example, if the backstep is set to 3, then the ZigZag indicator will only draw a new line or swing if the price has moved in the opposite direction for at least 3 bars or candles since the last swing. This helps to filter out minor price fluctuations and noise and only draws new swings when the price has moved significantly in the opposite direction.
The backstep parameter can be used in conjunction with the deviation and depth parameters to help traders identify potential trend reversals and entry or exit points for their trades.
It's important to note that the optimal value for the backstep parameter can vary depending on the market being analyzed, the trading strategy being employed, and the time frame being used. Traders should experiment with different values to find the setting that works best for their specific needs.
![]()
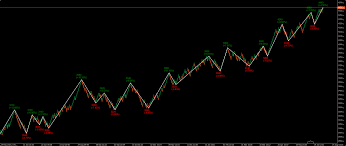
Example of how to draw the ZigZag lines manually, inputs are (Deviation of 5%, a Depth of 12 and Backstep of 3)
Here is how to manually draw ZigZag lines using the specified input values of a deviation of 5%, a depth of 12, and a backstep of 3.
Let's assume we are looking at a EUR/USD chart with a time frame of 1 hour. Here is an example of how to draw the ZigZag lines manually:
-
Identify the first swing high or low point. This is the starting point for the ZigZag line.
-
Move forward on the chart until the price moves in the opposite direction by at least 5% from the starting point. This is the first swing low or high point, depending on the direction of the trend.
-
Mark the swing low or high point as the end point of the first ZigZag line.
-
Move forward on the chart until there have been at least 12 bars or candles since the last swing point.
-
Look for the next swing high or low point that satisfies the deviation and depth criteria.
-
If the new swing point is in the same direction as the previous ZigZag line, mark it as the end point of the current ZigZag line. If the new swing point is in the opposite direction, mark it as the end point of the current ZigZag line and draw a new ZigZag line from the previous end point to the new swing point.
-
Repeat steps 4-6 until the end of the chart.
-
If the current ZigZag line does not have an end point due to the lack of sufficient swing points, the line is considered incomplete.
-
When a new swing point is identified in the opposite direction to the current ZigZag line, mark it as the start of a new ZigZag line.
It's important to note that manually drawing ZigZag lines can be a time-consuming process, especially on longer time frames or when analyzing multiple markets. The ZigZag indicator can automate this process and provide traders with an objective tool to identify trend reversals and potential entry or exit points.
ZigZag Advanced:
https://www.mql5.com/en/market/product/90750?source=Site+Profile+Seller
ZigZag Simple:
https://www.mql5.com/en/market/product/90998?source=Site+Profile+Seller
-----
What are the differences between the ZigZag Advanced & ZigZag Simple?
1- The price is the 1st difference. So, the Simple version is lower cost than Advanced version. Why?
2- ZigZag Simple has only the standard trading strategy while the ZigZag Advanced version has more to do.
3- ZigZag Advanced will be updated in the future while the Simple version will be kept as it is.
When to open a buy and sell position with ZigZag indicator?
It's important to note that the ZigZag indicator should not be used in isolation to open buy and sell positions. It is typically used as a tool to identify potential trend reversals and entry or exit points, and should be combined with other technical indicators and/or fundamental analysis to make trading decisions.
That being said, here are some examples of how the ZigZag indicator can be used in combination with other analysis to open buy and sell positions:
The ZigZag indicator can be used in a variety of ways to help traders identify potential buy and sell signals. Here are a few examples:
-
Trend following: One of the most common uses of the ZigZag indicator is to identify the overall direction of the trend. Traders can look for a series of higher highs and higher lows to identify an uptrend or lower lows and lower highs to identify a downtrend. When the trend is established, traders can look for potential entry points in the direction of the trend when the price retraces to a swing low or high point identified by the ZigZag indicator.
-
Reversal trading: The ZigZag indicator can also be used to identify potential trend reversals. Traders can look for a change in direction of the ZigZag lines to identify a potential reversal. For example, if the ZigZag lines have been moving up and then start to move down, this could indicate a potential reversal to a downtrend. Traders can then look for a sell signal when the price retraces to a swing high point identified by the ZigZag indicator.
-
Breakout trading: Another way to use the ZigZag indicator is to identify potential breakout opportunities. Traders can look for a consolidation or ranging period where the price is moving sideways and the ZigZag lines are relatively flat. When the price breaks out of this range, traders can look for a buy or sell signal in the direction of the breakout using the swing high or low points identified by the ZigZag indicator.
Buy positions:
- Look for a bullish divergence between the price and the ZigZag indicator. Open a buy position when the ZigZag line breaks above the previous high swing point.
- Look for a bullish chart pattern, such as a double bottom or ascending triangle, that is confirmed by the ZigZag indicator breaking above the pattern's resistance level.
- Look for a bullish candlestick pattern, such as a hammer or bullish engulfing, that is confirmed by the ZigZag indicator breaking above the high of the pattern.
- Look for a pullback in an uptrend that is confirmed by the ZigZag indicator breaking above the previous high swing point.
- Look for a breakout of a key resistance level that is confirmed by the ZigZag indicator breaking above the same level.
- Look for a bullish crossover of the ZigZag indicator with a moving average or other trend-following indicator.
ZigZag Advanced:
https://www.mql5.com/en/market/product/90750?source=Site+Profile+Seller
ZigZag Simple:
https://www.mql5.com/en/market/product/90998?source=Site+Profile+Seller
Sell positions:
- Look for a bearish divergence between the price and the ZigZag indicator. Open a sell position when the ZigZag line breaks below the previous low swing point.
- Look for a bearish chart pattern, such as a head and shoulders or descending triangle, that is confirmed by the ZigZag indicator breaking below the pattern's support level.
- Look for a bearish candlestick pattern, such as a shooting star or bearish engulfing, that is confirmed by the ZigZag indicator breaking below the low of the pattern.
- Look for a pullback in a downtrend that is confirmed by the ZigZag indicator breaking below the previous low swing point.
- Look for a breakout of a key support level that is confirmed by the ZigZag indicator breaking below the same level.
- Look for a bearish crossover of the ZigZag indicator with a moving average or other trend-following indicator.
Again, it's important to use the ZigZag indicator in combination with other technical and/or fundamental analysis to make informed trading decisions
Published products
MetaTrader 4


