
How to Analyze the Market with the AOTI and CTRA v1.0 Module

Today, using several examples, I want to explain how to analyze the market complexly with the AOTI indicator and the Current Trend Reversal Arrow (CTRA) module.

Product Name: All-in-One Trade Indicator (AOTI)
Product URL: www.mql5.com/aoti
Manual and Settings Description: AOTI Manual and Settings Description
AOTI VII – New Generation Trading Indicator: Read More

The Lyrical Preamble About the Importance of Complex Analysis in Trading
When I started trading more than 16 years ago, I went through hundreds of different indicators, looking for a few, or at least one indicator that would be good for all market phases. Be it a trend or flat, volatile or not so volatile trading instrument. There has to be a universal solution, right?
Of course not. I apologize for the sad truth. I'm talking about those indicators that we are used to seeing in our terminals. Classic MA, MACD, RSI… They are still good, but each of them separately will not help us to successful trading. The reason is that as a rule, each indicator has been created for its specific task and does not allow to analyze the market as a general mechanism and analyses only its separate part.
And after combining them into a system with a certain set of rules, we get the very complex analysis, which allows us to see the whole picture, rather than its separate parts.
For example, I see a picture of a beautiful girl in which many places are closed (due to morality or some other considerations). “But this girl is gorgeous! Why can't I see the whole thing?”, – I shout, and I want to see her in whole, to make conclusions for myself, not to be at the mercy of imposed ideas.

It's the same with market analysis. You see part of the picture that one indicator shows you, but you're missing something. Perhaps something quite obvious (something that lies on the surface, like in Allan Poe's novels), but because you do not expect to see it, you do not see it.
The Importance of Using Additional Trading Signals of the All-in-One Trade Indicator (AOTI)Look at the whole picture of the market, do not allow yourself to look at the market with one eye, or, metaphorically speaking, through “dark glasses,” and success awaits you as a reward.
You can also read about the importance of a complex approach to market analysis and the use of additional trading signals of the AOTI indicator here.


Examples of Analyzing the Market with the AOTI and CTRA Module
The Current Trend Reversal Arrow (CTRA) module has been available since the 7th version of the All-in-One Trade (AOTI) indicator. This module combines many parameters and several analysis systems. At the same time, I wanted to see this module as easy to understand as possible. The indicator performs a lot of calculations and analytical work. As a result, we get a simple and clear signal to buy or sell in the form of an arrow and a message on the indicator control panel. In the new versions of the CTRA module, I plan to improve its characteristics even more.
Let's move on to examples.
The CTRA module's Current Trend signal is the same as the Daily Forecast signal.
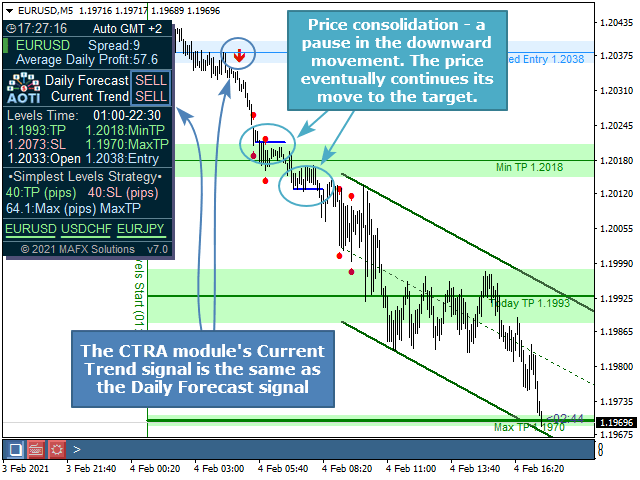
We can see price consolidation areas on the chart, indicating a price weakness for further downward price movement in this period. It is potentially a good time to move your stops to Breakeven or close part of your position (depending on your strategy).
Then we see the price has reached the Today TP level and is consolidating near it, with the risk of reversing and moving in the opposite direction. But finally, making a false break up and not passing the Today TP zone goes down to Max TP‘s level.

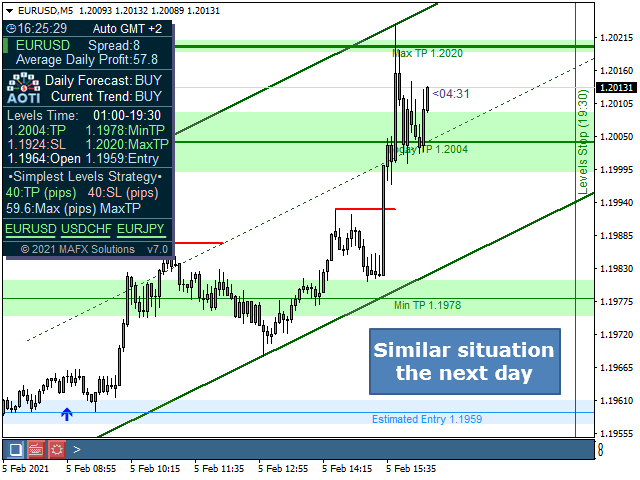
We see an almost identical situation the next day. The only difference is that the pullback after the resistance levels appeared is more significant than the day before. The price reversal attempt is more serious.

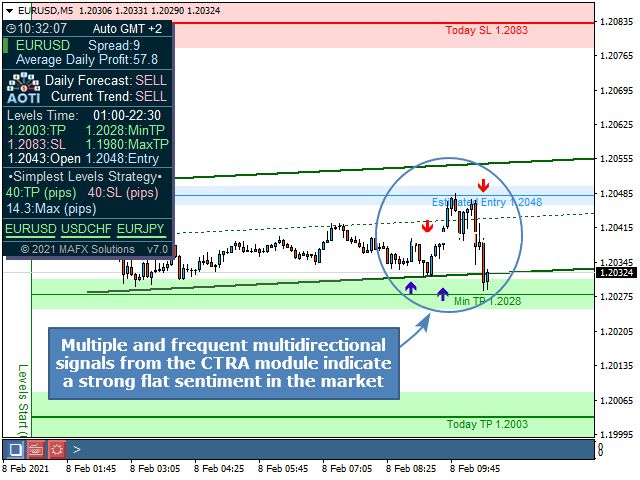
But we see a much more exciting and complicated situation after the weekend. The beginning of the movement is very similar – the Daily Levels are aimed to Sell. Some later, we get a confirmation signal to Sell from the Current Trend Module.

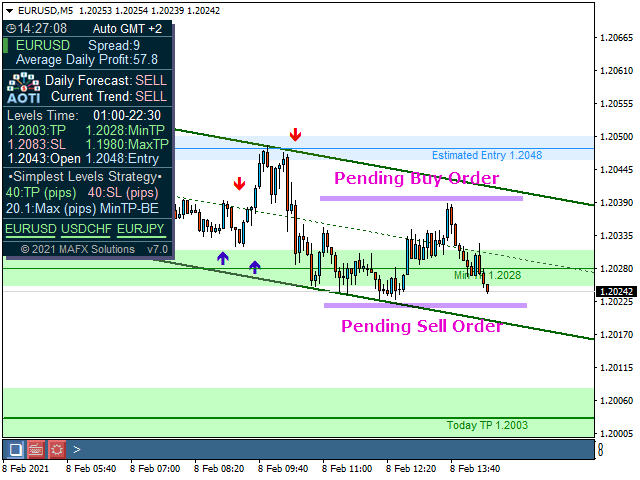
But then the price movement calms down, and the market begins to flat.
Multiple and frequent multidirectional signals from the CTRA module indicate a strong flat sentiment in the market. Of course, each of these signals could be closed at least to breakeven, but that's still not exactly what we expect from the market. We see evident price uncertainty with unclear further movement. Even if we were at breakeven, it was knocked out long ago, and we can no longer wait to see what happens next in safety.
At the next step, we can stay out of the market or place pending orders to break the flat corridor boundaries built by the price.
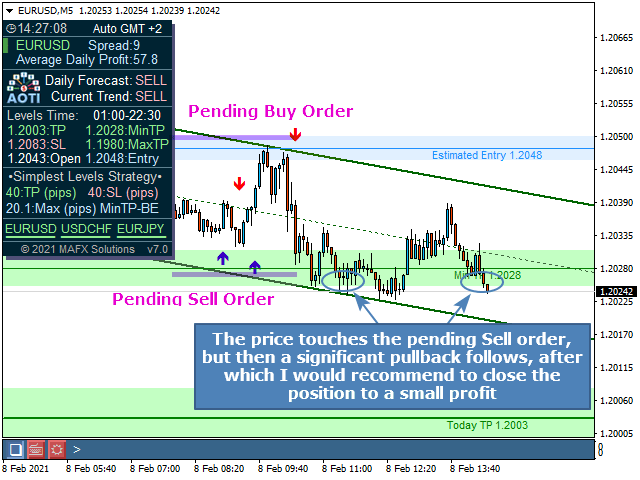
The price touches the pending sell order, but then a significant pullback follows, after which I would recommend to close the position to a small profit and again wait for the next breakout of the new flat zone formed by the price.
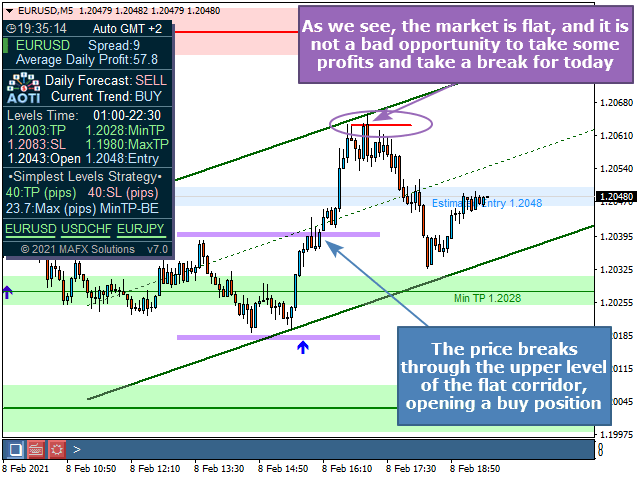
The price breaks through the upper level of the flat corridor, opening a buy position. But since we have already realized that a flat sentiment prevails in the market, it is advisable not to leave our open position in the market for a long time. In our example, we have an opportunity to close a small profit on the micro-level of resistance and take a break for today.
Here are some examples of how you can use the AOTI module and CTRA v1.0 to simplify complex market analysis. In the following articles, I will consider more examples of using the AOTI indicator and its built-in features.
Read other articles about the All-in-One Trade (AOTI) indicator and its features and functions.
Product Name: All-in-One Trade Indicator (AOTI)
Product URL: www.mql5.com/aoti
Manual and Settings Description: AOTI Manual and Settings Description
AOTI VII – New Generation Trading Indicator: Read More


