
Professional Trading With Double Tops/Bottoms And Divergences!

How To Yield Big Winners Consistently!
If you have purchased the Double Top/Bottom indicator and are interested in learning to trade DTB-signals from experienced traders then you can join the FREE telegram group with 480+ members. Please send me an email to: telegramDTB@forexfalcon.com
In this article you will learn killer trading strategies with a professional top-down approach that you have probably never seen before!
If you’re interested in achieving big intraday winning trades on a regular basis, the day trading method presented in this article is just what you’re looking for. Furthermore, if you’re inclined to holding trades overnight, or over a few days’ period, the potential profits of your winning trades can be even much greater!
The winning trades can potentially yield huge profits because the trading method will allow you to enter into trades of major trend reversals at the earliest stage possible. You will manage to catch those major trend reversals on a regular basis because of the inherent trading edge provided by the day trading method, whereby a trend reversal signal of a bigger time frame is combined with a trend reversal signal of a lower time frame.
This trading method is based on the ULTIMATE Double Top/Bottom Indicator. You can get a free version of the indicator which is bound to EURUSD + GBPUSD and an unlimited paid version here:
Free ULTIMATE Double Top/Bottom Indicator
Unlimited ULTIMATE Double Top/Bottom Indicator
Scanner Version (30 instruments / 8 time frames):
The rationale and logic of the trading method is to exploit the constantly repeating and never-ending cycle manifested by the smart money, which comprises the following moves:
1. Accumulation
2. Trapping
3. Trend Reversal
The screenshots below exhibit a double bottom and a double top signal given by the ULTIMATE Double Top / Bottom Indicator:
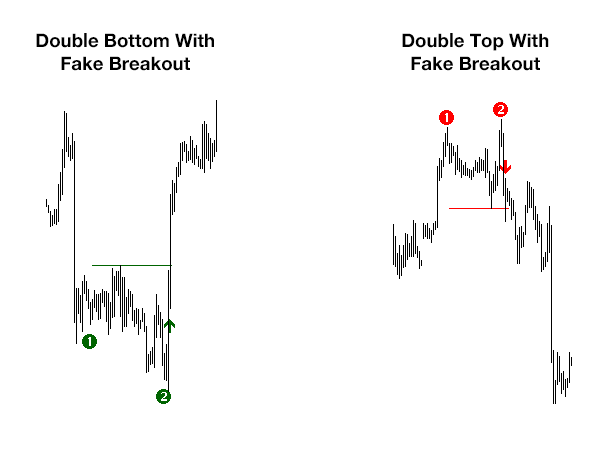
The reversal patterns detected by the indicator come with many different names, but they’re the same animals, which may be known to you as “Bear/Bull Traps” or “Double Tops/Bottoms With Fake Breakouts”.
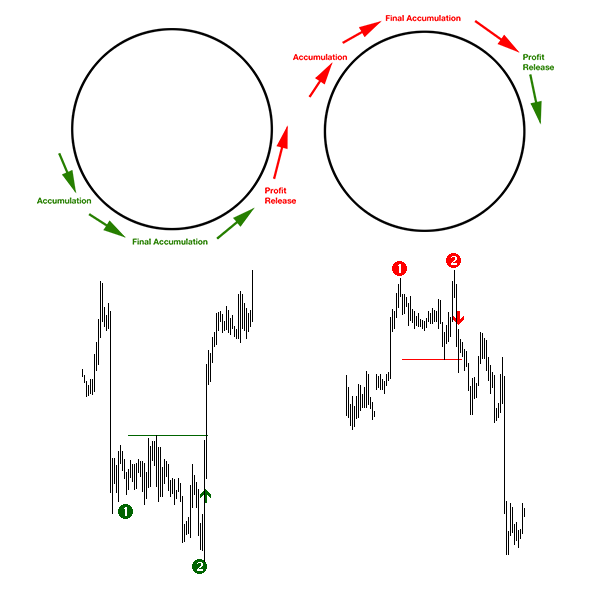
The trick of the smart money is to use such reversal patterns to build up a huge position at the best possible price before it changes the trend direction. The two sketches shown below schematically depict the reversal patterns, where the fake breakout occurs, and where the entry signals are given by the indicator.
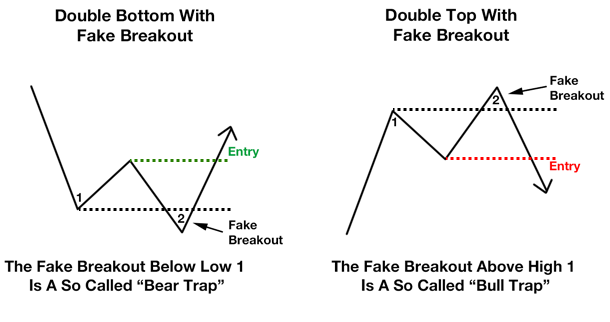
In order to help you understand how and why you could profit consistently by using this trading method, we shall further examine these reversal patterns.
“If you know the enemy and know yourself,
you need not fear the results of a hundred battles.”
~ Sun Tzu, The Art of War
Know How The Smart Money Fools The Herd – While You Confidently Make Profits
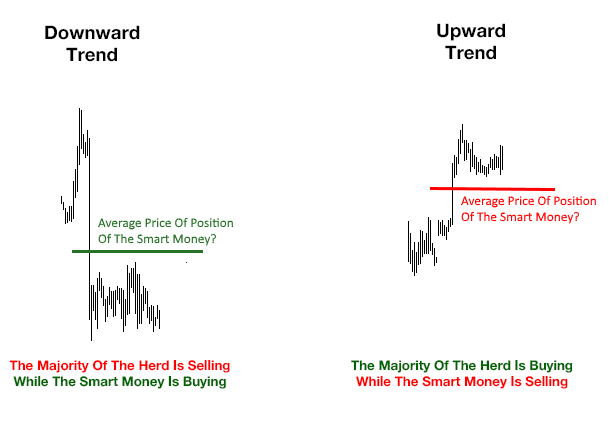
The screenshot on the right shows an upward trend. Likewise, based on our thesis, we know that the herd is net buying, while the market maker is net selling. In other words, the market maker is building a net short position. However, the average price of the market maker’s overall short position is below the latest market price, again, the market maker is holding a net short position with deep paper loss.
The smart money, a.k.a. market maker, by default has the most market information compared to all other players, and it moves the biggest amount of money in the market. Therefore, it has the power to move the prices significantly. If the market maker intends to reverse the trend direction, it will first optimize the average price of its overall position.
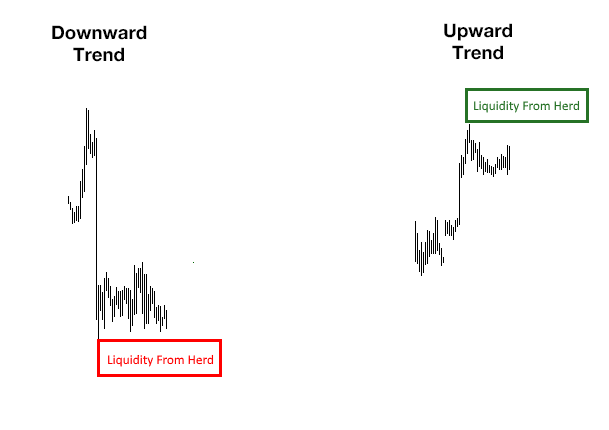
The million dollar questions is “How does the market maker optimize the average price of its own position?” It is known to the market maker that there is a lot of liquidity from the herd when the market hits new lows in a downward trend, or when the market hits new highs in an uptrend. The screenshots below show the areas where high liquidity from the herd can be expected:
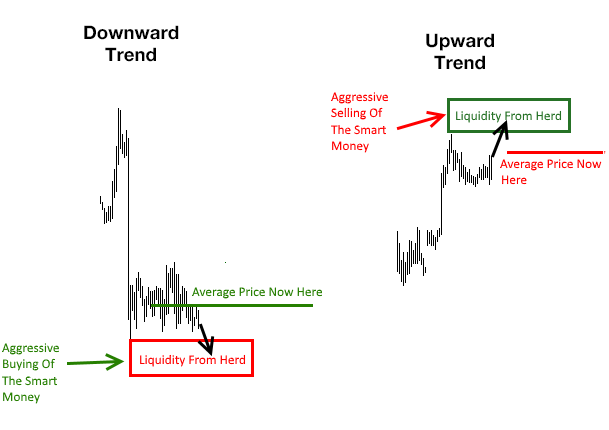
The two screenshots below depicts the outcome of how the market maker’s trick of “increasing its position size at the very best average price level”. The average price of the market maker’s position is now much closer to the prevailing market price.
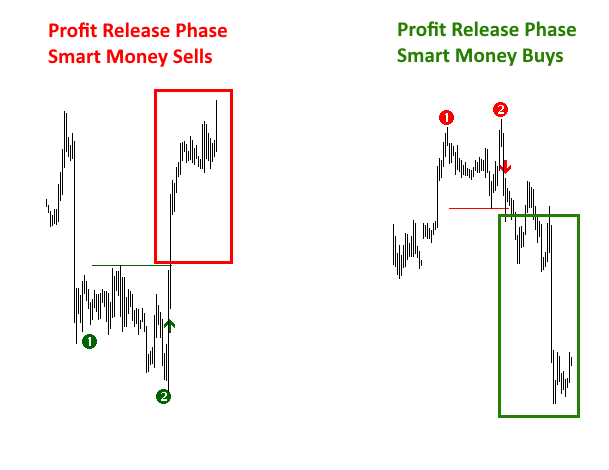
Once the liquidity of the herd has been absorbed, it is time for the market maker to transform its accumulated position into profits. The liquidity from the herd will then dry up when the herd notices that the trend has been stopped in its track.
Subsequently, the market maker increases the size of its own holding for one last time. This last heavy adding by the market maker reverses the direction of the price action.
With this reversal, the market maker leaves its foot prints on the chart in the form of a double bottom or a double top. Seeing the sudden reversal, more and more members of the herd are closing their positions in panic, resulting in the neckline of the double bottom / double top being broken, which is exactly the point where the ULTIMATE Double Top/Bottom Indicator provides the entry signal.
The end result, you’ll see a very fast price move in the opposite direction of the previous trend. This fast price move constitutes the profit release phase of the market maker, the phase in which the market maker exits its previously accumulated position with profits.
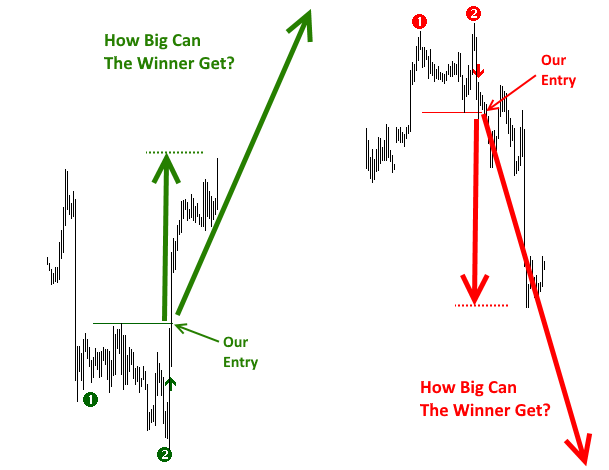
Since our entry is at the break of the neckline of the trend reversal, we will have joined the ride in the direction of the market maker’s profit release phase. And the size of potential profits of our winning trades will be directly proportional to and dependent on the size of the market maker’s profit release phase!
In the next part of this article, we shall reveal how you can select those high probability setups that can yield crazy winning trades with huge potential profits on a regular basis!
In the video that follows, you will see how the ULTIMATE Double Top/Bottom Indicator could have produced 128% in profit with only 35 trades and 2% risk per trade. Although the indicator’s raw signals could yield great performance, I’d highly recommend that you filter out some of the signals, taking on only those signals that are in sync with the bigger picture so as to gain additional edge, and to participate only in trades that will most likely give you extremely huge profit potential.
Trading with more edge is a highly recommended good practice. For the greater the trading edge, the easier it will be for you to handle the psychological aspects of trading!
How To Select Big, Crazy Winning Signals
Based on my personal experience of interacting with 500+ members in the FREE Double Top/Bottom Telegram Group (contact me via email: mike@forexfalcon.com), I’ve noticed that the members have the greatest success with signals of the M30/H1 time frames.
Overall, these two medium time frames provide a good balance between quantity and quality -- the number of signals and the profit potential of the winning trades.
For instance, assuming that the two signals (the double bottom and top from our screenshot) are from the M30 time frame. You can trade these signals prompted by the ULTIMATE Double Top/Bottom Indicator successfully by looking at the M30 time frame only.
However, if you just refer to the M30 chart alone, it is difficult for you to ascertain when an extremely big winning trade can be expected. To be safe, you would then have to set a smaller profit target for all your trades.
It is said that a picture is worth a thousand words. Let me summarize the above arguments and rationale in picture form. The following diagram shows the relatively small market maker cycle of Accumulation, Trapping (final Accumulation) and Profit Release that you would trade if you only pay attention to the M30 time frame:
If like me, you prefer to have big and crazy winning trades on a regular basis, then it’d be most helpful to choose only those double top/bottom signals that give you extra edge, signals that are in sync with the bigger picture!
There are many ways to gain an extra edge by taking into account the bigger picture to select the best possible double top/bottom signals that occur on lower time frames. In this article I will show you how you can use divergence on the H4 time frame to filter the raw signals and select the best double top/bottom signals on the M30 and H1 time frames.
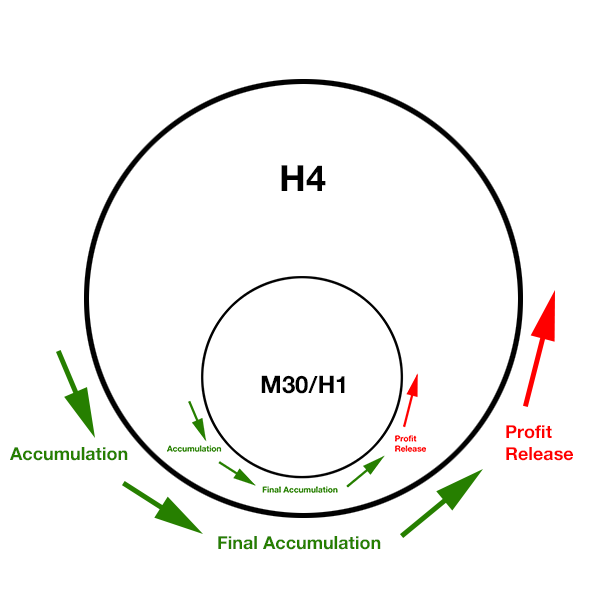
By trading the double bottoms on the M30/H1 time frames within a bullish divergence on the H4 time frame, essentially, you’d be trading a small market maker cycle within a bigger market maker cycle. This approach allows you to enter into a huge profit release phase of the bigger cycle, while making it possible for you to place a relatively much smaller stop based on the smaller market maker cycle.
The following diagram shows the smaller M30/H1 cycle nested within the bigger H4 cycle:
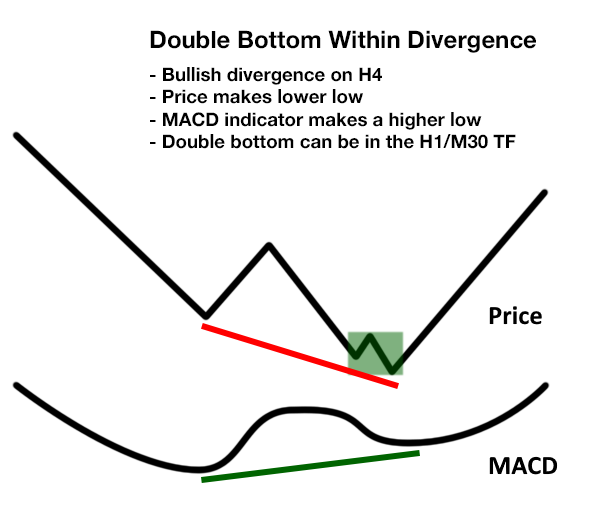
On the chart the price action will appear as shown in following diagram. A double bottom (green rectangle) occurs within a bullish divergence. In such a scenario, we can expect the subsequent move to the upside and the profit potential will be huge!
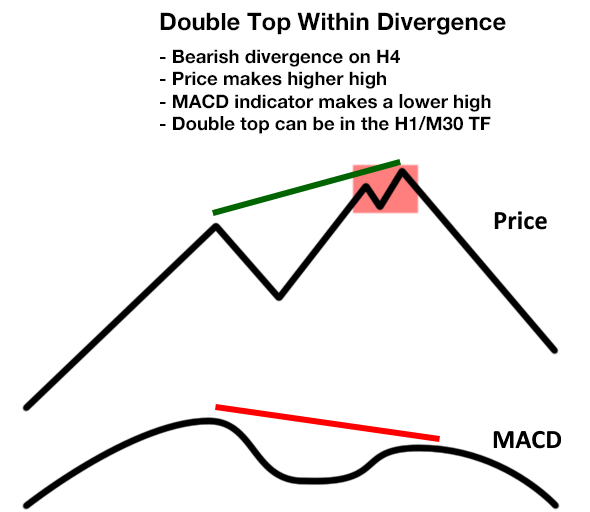
You will have similarly big, crazy winners with short trades if you choose double top signals on the M30/H1 time frames that occur within a bearish divergence on the H4 time frame. In this scenario, likewise, you will also be able to enter a trade to ride a big downward move, which is the profit release phase of the big cycle, with a relatively tight stop based on the signal of the lower time frame.
The following diagram depicts the two nested downward cycles, with the small cycle embedded within the big cycle:
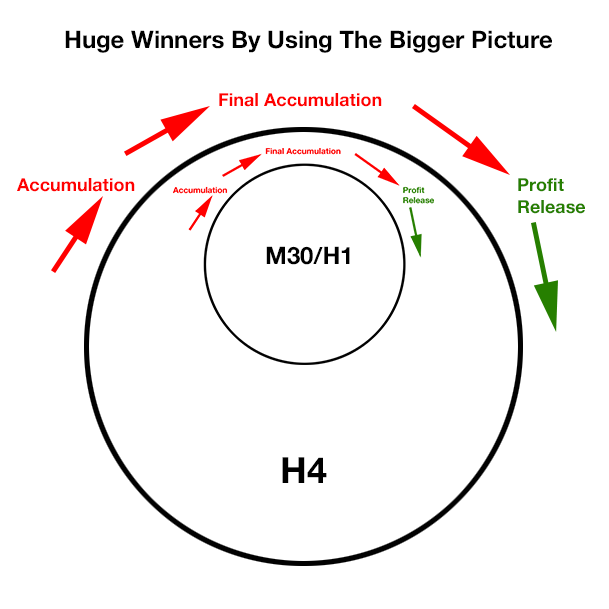
On the chart, it will look as shown in the following diagram. A double top signal occurs on M30/H1 within a divergence on the H4 timeframe:
Such signals occur rather often. If you wish to improve your trading results significantly, all you have to do is wait for these signals with patience! Good things happen to those who wait, those who are not trigger happy. This is one reliable way to enhance your trading edge and your profits!
A Real Example Of A Big, Crazy Winner
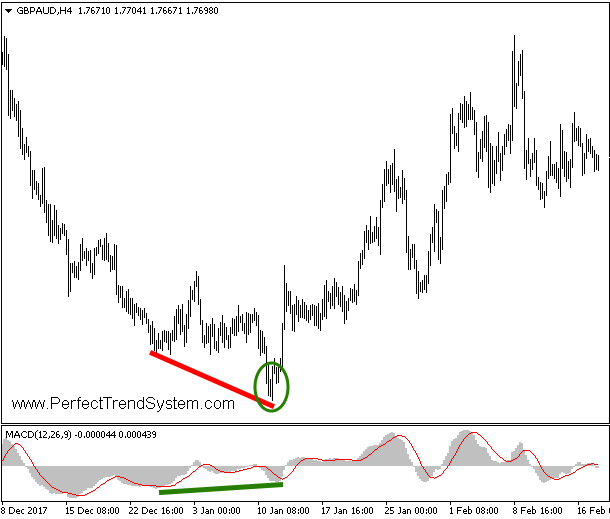
Let us now take a look at a real example on the chart. As you can see, the following screenshot shows a bullish divergence on the H4 time frame after a strong downward trend. A double bottom signal was given by the FREE Double Top/Bottom Indicator on the M30 time frame in the area labeled with the green ellipse:
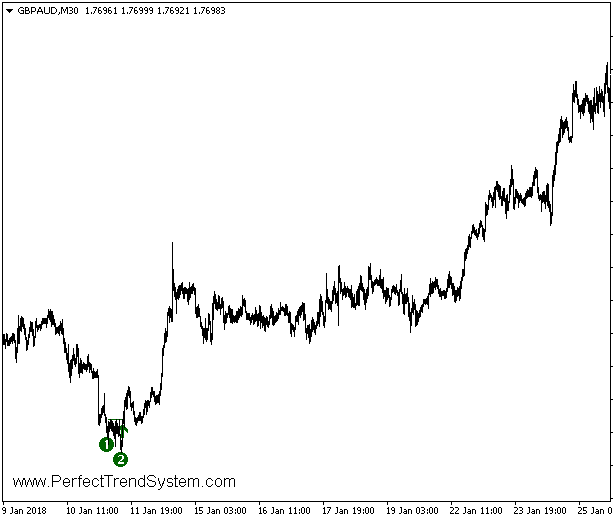
The screenshot below shows the double bottom signal on the M30 time frame:
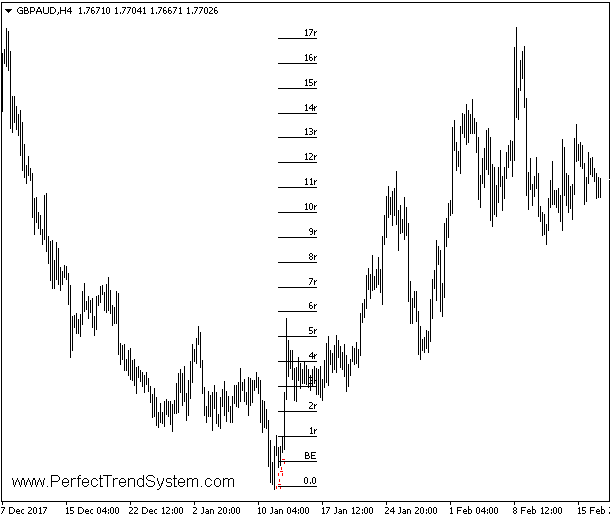
As shown in the next chart, this double bottom signal could have produced a 17R (1R = the risk of your trade, e.g. 34% profit if you risked 2% with this trade). You could certainly increase your equity significantly if you could just string together a sufficient number of such trades!
Armed with this trading method, you have a most valuable tool and the key to trading success in your hand. All you have to do is to be patient, do not be trigger happy, wait patiently for such setups and then let the ULTIMATE Double Top/Bottom Indicator inform you when to place your trades. Even if you’re an intraday trader, you can still attain significant profits if you combine the edge of the bigger picture with the edge of the double top/bottom signals.
Free ULTIMATE Double Top/Bottom Indicator
Unlimited ULTIMATE Double Top/Bottom Indicator
Scanner Version (30 instruments / 8 time frames):
Free ULTIMATE Double Top/Bottom Scanner
Unlimited ULTIMATE Double Top/Bottom Scanner


