

I am often asked how to trade using the levels of the All-in-One Trade (AOTI)? When we need to enter a position and when to get out of it? Today we learn all the rules of work with these levels.
I will supplement this article with new information, as I think that will not immediately be able to tell all the details. It would take too much time.
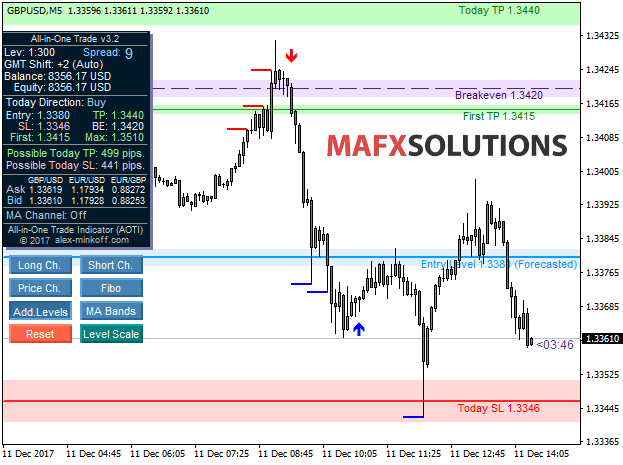
Description of the AOTI Indicator Levels
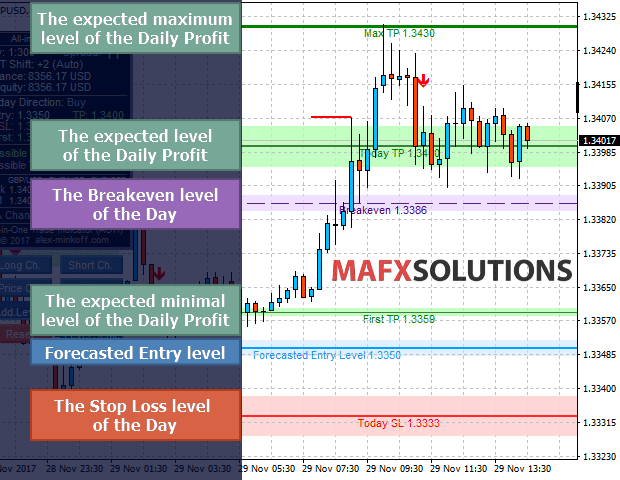
- Forecasted Entry Level – the predicted level from which the price may start moving to the target level. You can use this level as an entry point, or you can seek entry point the other ways.
- Breakeven – the level, at which the stop loss can be moved to breakeven.
- Today TP – the expected level of the daily profit.
- Today SL – the stop loss level of the day.
Additional levels (activated by the Add. Levels button in the control panel):
- First TP – the expected minimum level of the daily profit.
- MaxTP – the maximum allowed profit level (for a very volatile market).
![]()
 Read more about: AOTI Indicator Settings
![]()
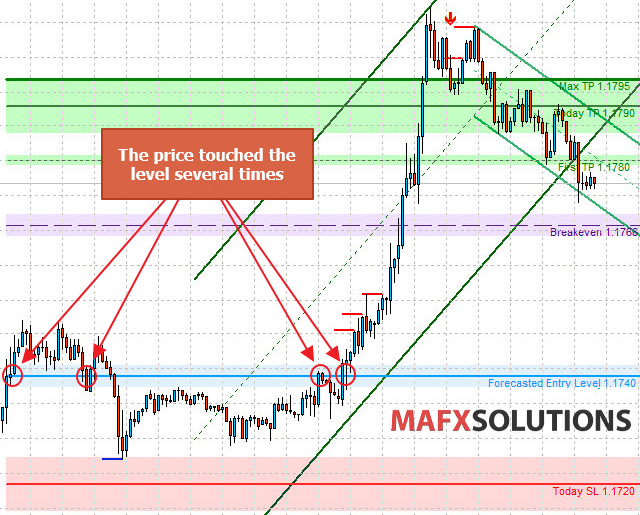
About Forecasted Entry Level
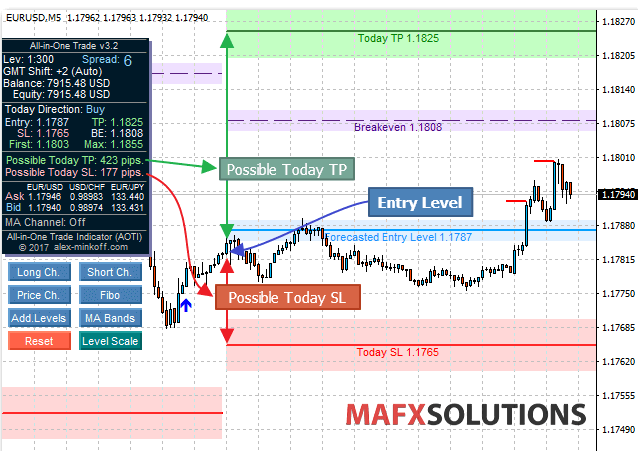
Forecasted Entry Level is a strong level, which is calculated according to several criteria. Price tends to touch this level and then start moving to the target level.
An example of good work of the level:
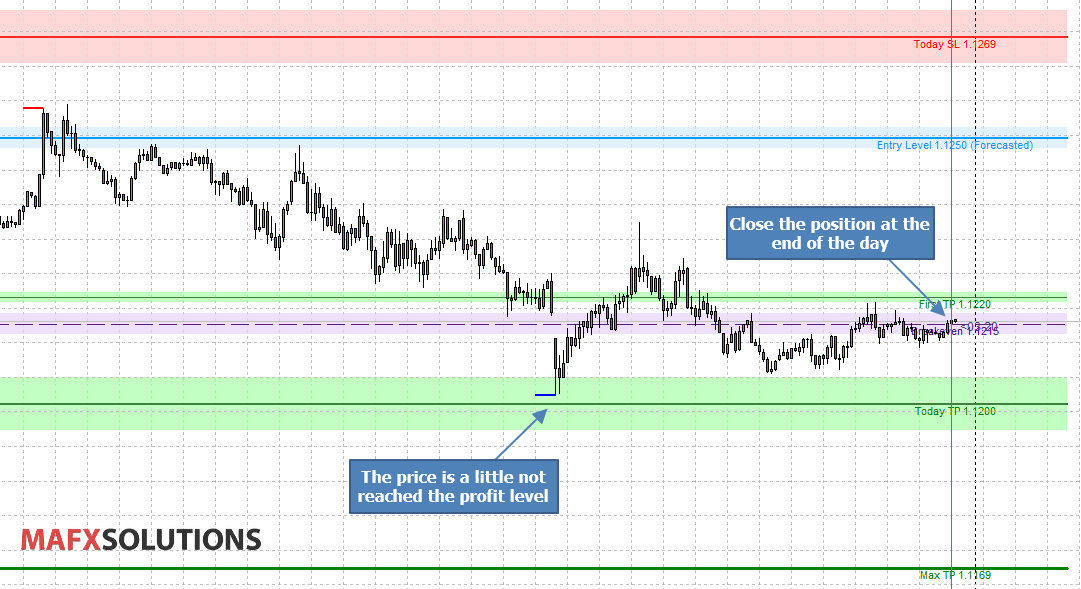
But it could be different.
Only 2,2 pips were not enough to reach the level:
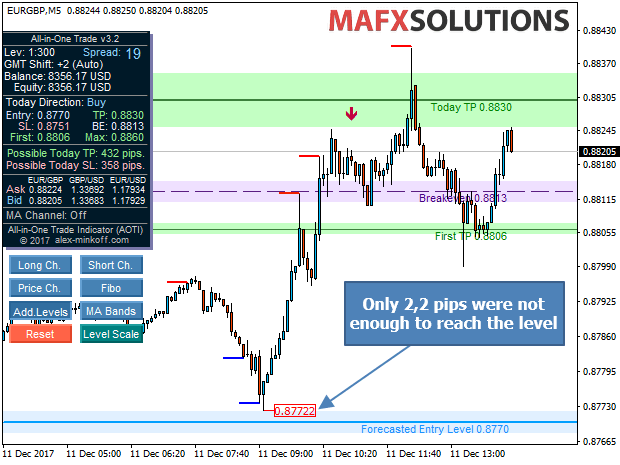
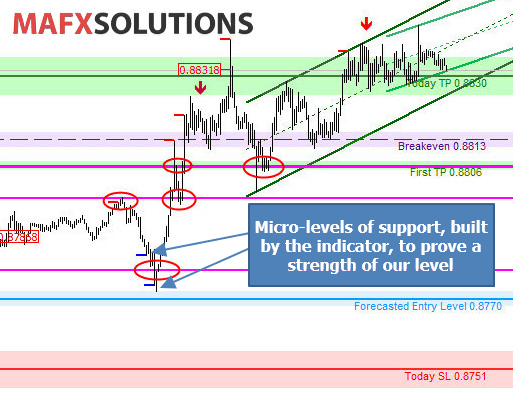
How can we enter the position, if the price has not reached the Forecasted Entry Level?
In fact, it is not so difficult. Just look at the nearest levels of support/resistance.
If we build the simplest levels from which the price bounces, we can see a great entry point. Support turns into resistance and resistance into support.
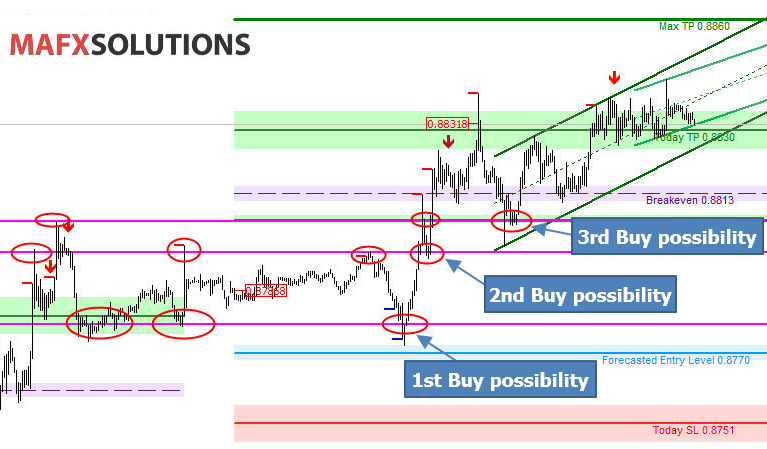
Extra tips from the support micro-levels, built by the indicator:
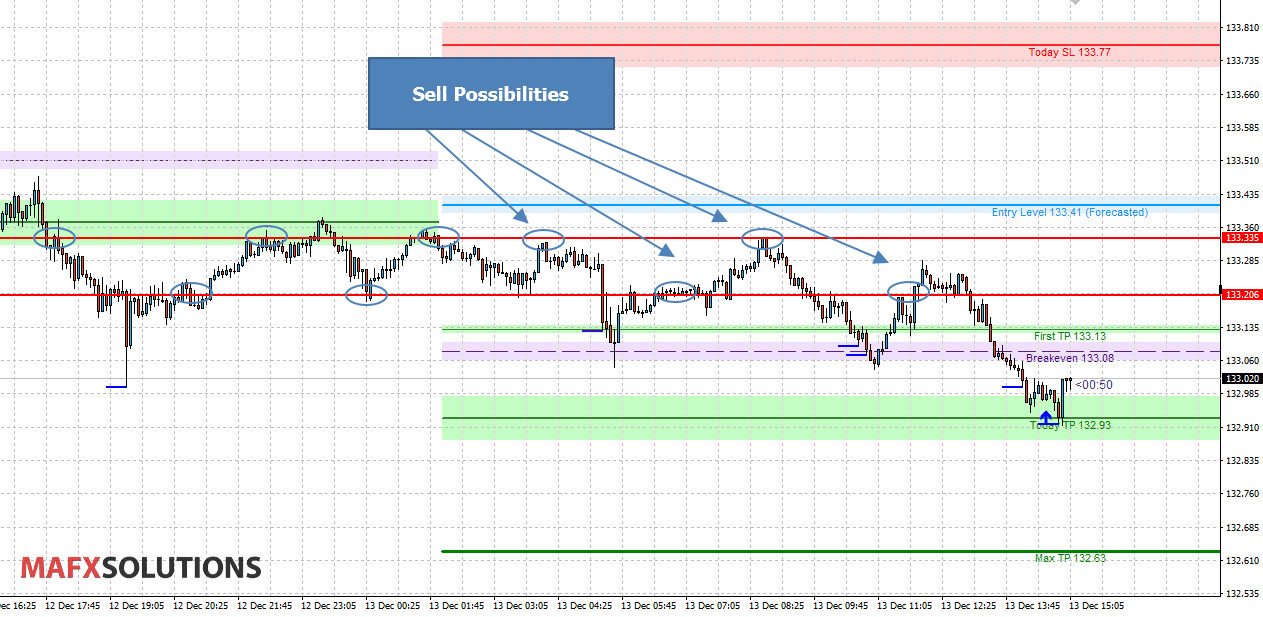
Another example:
In one of the next version of the indicator, I will try to do an automatic search and display of such levels.
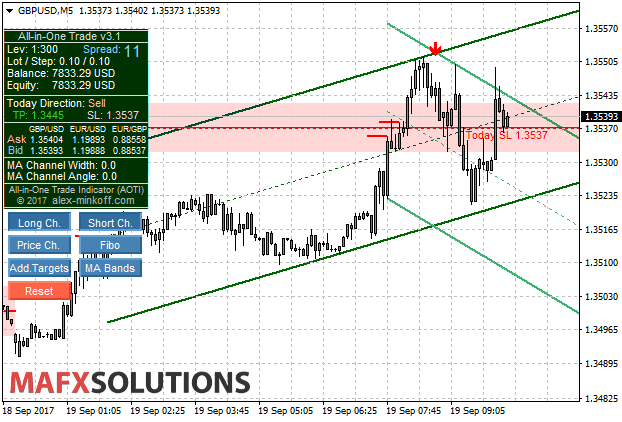
The Simplest Way to Trade by the Levels
If you are really busy and you can’t trade during the business day, you can use the simple trading strategy for the levels.
It’s very simple. We just open a trade in the time of appearance of the levels. Then we hold the position open until the price reaches the level of Today TP or Today SL.
To simplify the process of trading, we don’t use the other features of the indicator.
We close the position at the end of the day with a profit or loss.
The results of testing this simple strategy I have shown here and here.
Of course, you can use this simple strategy, but I recommend to better understand the indicator and its functionality to increase your potential profits. You can also try to combine it with your trading style and create your own strategy in which you will have confidence in executing.
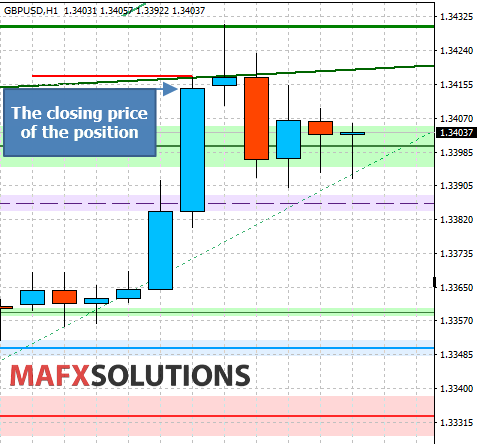
Closing Positions After a Candle Close
I want to tell you about another idea that I use in real trading.
We close the position only after a candle closes above (or below) level.
What does it mean? Usually strong level means the accumulation of interests of a large number of players on it. As a result, it often happens that the price only slightly poking the level to knock-out the traders stop levels.
If we trading on small timeframe like M5 (to reduce possible loss), we can close the position only after the candle closes above (or below) level, as I said earlier. Then a simple poke of the level by a price doesn’t throw us out of the position.
On the same principle, we can take the profit. We also can try to do it on the bigger timeframes, like H1.
Mass Closing of the Positions
One interesting regularity for you.
When the price reached the target on the first pair, it is possible to consider the possibility to close position on other pairs.
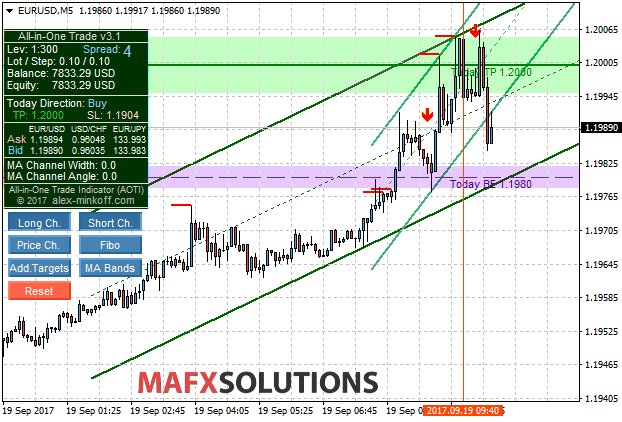
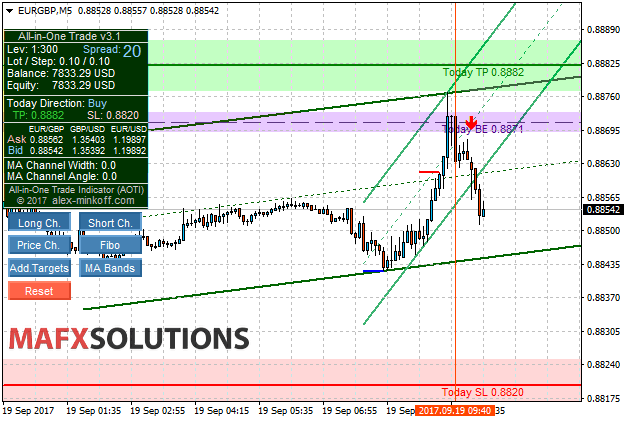
The price on the EUR/USD reached a profit (1.2000).
At this time on EUR/GBP pair the price was up to Breakeven level (0.8871). And we can close this position too.
And we have:
GBP/USD = -360 p.
EUR/USD = +450 p.
EUR/GBP = +260 p.
Total = 450 + 260 – 360 = 350 p.
Dynamic Stop Loss and the Decision to Open the Position
In the real trade, I always try to open positions in which the expected profit exceeds the possible loss.
To this rule, there are exceptions, depending on market and a trader’s experience. But for the beginners, it is a good decision.
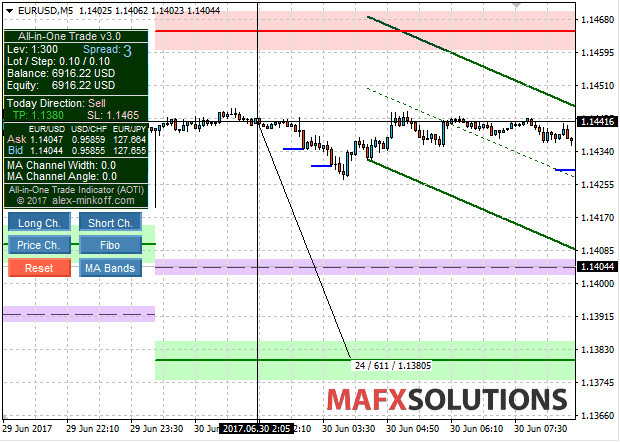
For example. At the day start possible Stop Loss = 237 p.
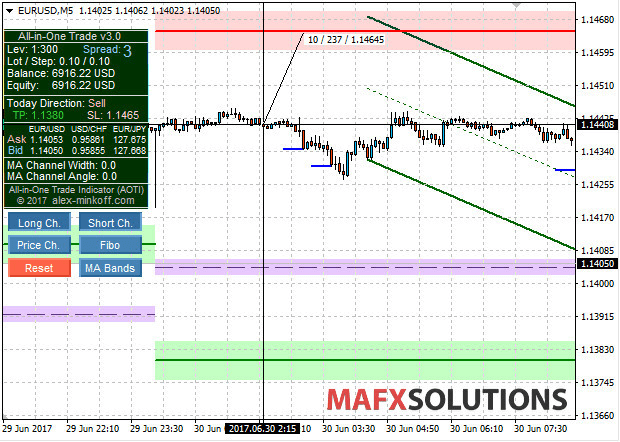
Possible Take Profit = 611 p. 611/237 = 2.5 (ratio). Good for the entry.
![]()
Well, thank you for your attention. That’s it for today.
Good Luck & Big Profits!


")

![[XAUUSD]: Weekly Liquidity Activation Points (timings), June 22-26, 2026](https://c.mql5.com/6/1013/splash-preview-771790.png "[XAUUSD]: Weekly Liquidity Activation Points (timings), June 22-26, 2026")