

Indicator All-in-One Trade (AOTI) is a complex instrument, consisting of several modules and strategies. I get many questions about how to use the indicator for profitable trading. Today I want to review the basic principles of working with the AOTI indicator.
Today we will consider in more detail the determination of the daily levels.
![]()
The main purpose of the All-in-One Trade Indicator
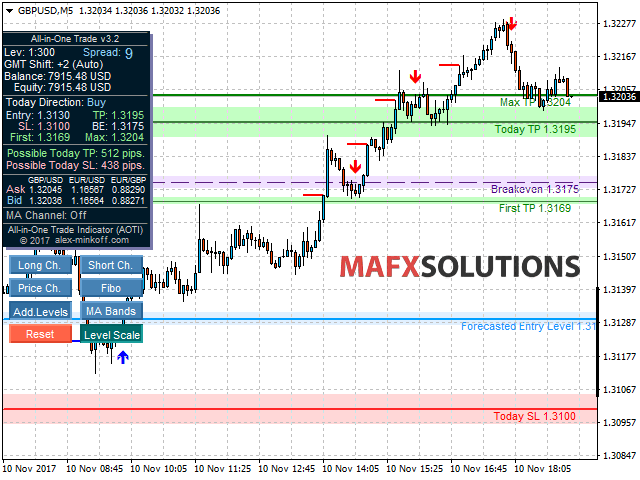
The main purpose of the All-in-One Trade Indicator (AOTI) is determining the daily targets for some currency pairs. The indicator includes many features like a Dual-channel Trend Detection, Price Channel, MA Bands, Fibo, etc. The indicator simplifies the analysis of the market and includes several trading strategies that I apply to real accounts.
AOTI is a contraction (abbreviation) of the full name All-in-One Trade Indicator.
In the current version 3.2, the indicator calculates daily levels for symbols EUR/USD, GBP/USD, EUR/GBP and EUR/JPY. Why I chose these currency pairs and when I add more?
Why these pairs? The answer is simple – a good correlation.
When do I add more pairs? To answer this question is not so simple. Initially, the daily levels detection system worked only on EUR/USD. However, with practice, I added the new pairs and now they show very good results. Some even better than EUR/USD. I constantly study the market, the market prices and the behavior of currency pairs. When I will see interesting patterns to build correlations, I will add that pairs in the indicator.
![]()
What timeframe is best for use with the indicator?
What the best price chart period (timeframe) to use for a trade? To determine the exact daily levels indicator uses different periods and different symbols. And not so matter what period you use.
As for me, I prefer the M5 period for strategies which are included in the indicator. On the M5 period is clearly visible the slightest price movement. Also if you know your daily levels, then you can choose the entry point much easier.
![]()
GMT Shift Auto Detection
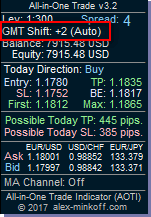
The indicator determines daily levels depending on the GMT Shift.
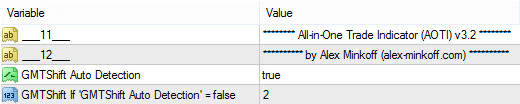
If GMTShift Auto Detection = true, then the calculation of the GMT Shift is done automatically.
This feature does not work on weekends, due to the fact that on weekends, the terminals of the brokers do not send their current time and no quotes.
On weekends, the GMT Shift value is taken from variable GMTShift If ‘GMTShift Auto Detection’ = false
How to set correct GMT Offset I wrote earlier. Nothing complicated about it.
![]()
How the AOTI determines the Daily Levels
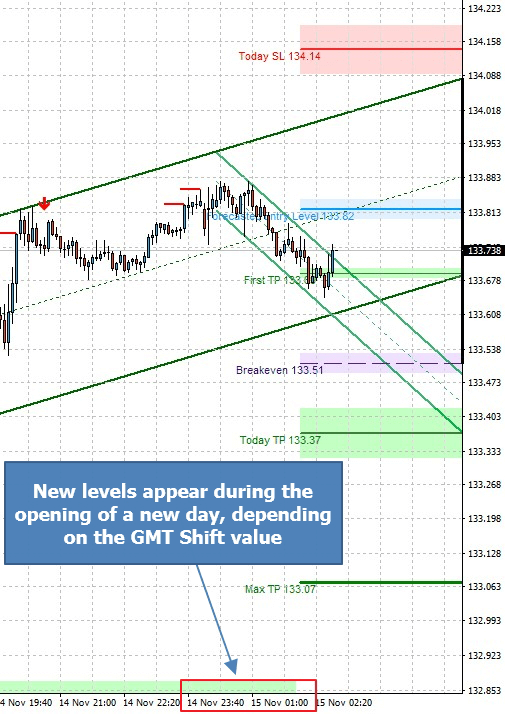
Indicator uses the specifics of the price movement, correlation of the pairs, analysis of the price movement speed, volume and spread. The indicator counts levels on various timeframes and pairs, checks their working capacity and force and shows optimum and strong levels for current day. New levels appear during the opening of a new day, depending on the GMT Shift value.
An example of how to calculate the levels when you install the indicator at any time:
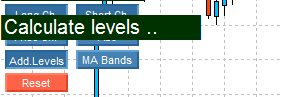
The final chart looks like this:
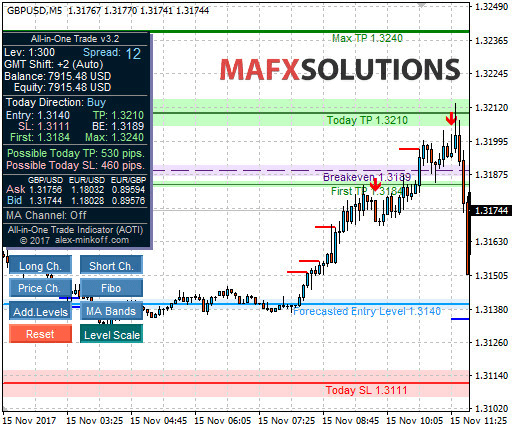
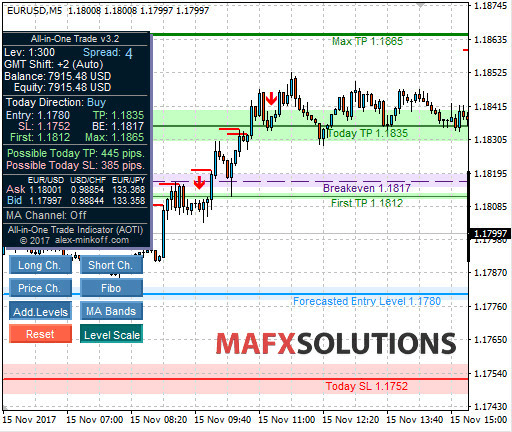
And EUR/USD for example:
Read more about the calculation of the daily levels you can here.
![]()
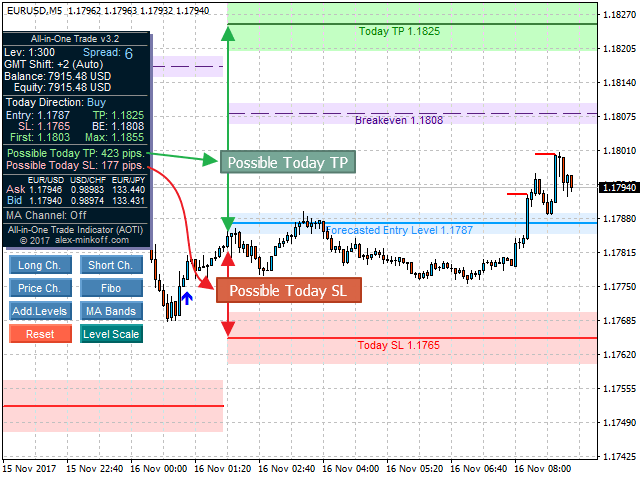
What is Possible Today TP and SL?
The distance between the opening price (at the time of occurrence levels) and levels of daily profit and loss.
This information is given in order to know the potential risk if you trade only by Daily Levels strategy. If the profit level will be much lower than loss level, then this deal should be skipped.
![]()
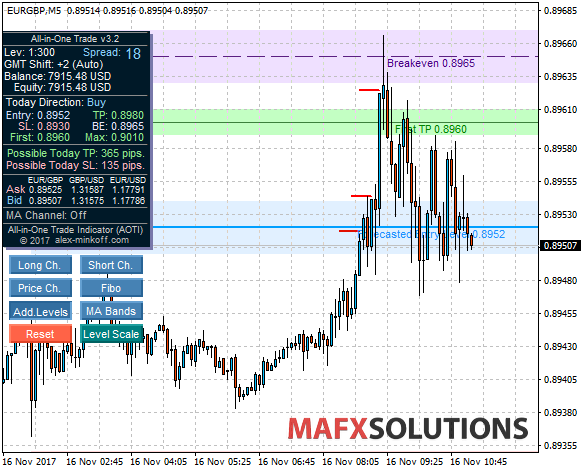
Why do we need Level Scale function?
When the indicator starts we see the levels as follows:
Level Scale is Off
But when we activate Level Scale, we can immediately see all the levels on the chart:
Level Scale is On
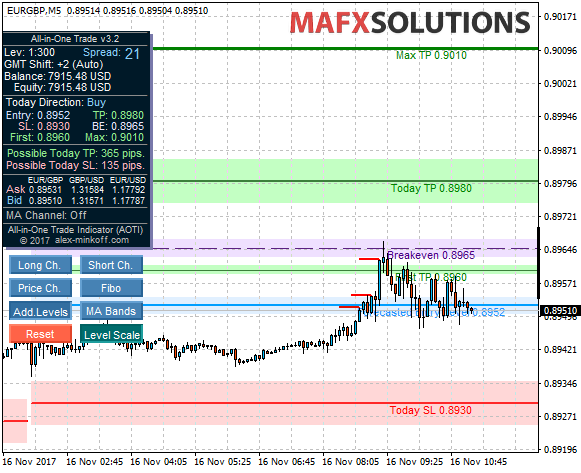
This is convenient because you can immediately assess the location of all levels and prices relative to them. You do not need to narrow down the screen vertically. Especially when you just narrow the screen vertically, the levels are not centered and it’s not as convenient as with the function Level Scale.
![]()
Trading results with the indicator AOTI v3.2
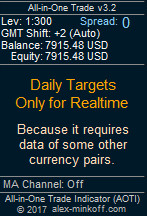
Unfortunately, the Daily Levels strategy cannot be tested in strategy tester of the MetaTrader4, because for Daily Levels calculation indicator uses data of different currency pairs and timeframes.
But I am sure in the profitability of this strategy, as for several years using it for EUR/USD. And this year I added 3 new pairs that are already well proven to work.
But despite the confidence, I spent a lot of time to manually test the work of daily levels for all 4 pairs for 1.5 months – from 1 October to 11 November 2017.
I carefully analyzed the history, calculated levels manually in order to see a profit, which shows the indicator (if you trade only by Daily Levels strategy). And even the simplest strategy, without considering the breakeven level, first profit, etc. has a very good result. Of course, if we used all the extra features and signals, the profits would be much greater. But my task was to test only the Daily levels.
For example, I decided that we open a trade in the time of appearance of the levels and kept it open until profit or to lose. And at the end of the day, the deal was closed in any case, no matter whether it was profit or loss.
Here’s the result of 4 pairs (5-digit quotes):
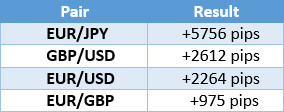
That is, we get for a month and 10 days approximately +11600 pips of profit. I think this is a good result.
But, nevertheless, I still want to improve the size of the loss. More precisely – reduce the size of the possible loss. But it will be in the new versions of the All-in-One Trade Indicator (AOTI).
My post, again, is very large, and I am risking to boring you )
Next time I will talk about the basic trading strategies with the AOTI indicator.


")
