Brent: the price may stay in the range until the end of November

The third day, oil is trading in the range after a sharp decline in the price at the beginning of the week. January futures for Brent crude oil fell in price by 0.21%, to 61.23 dollars per barrel. The spot price for Brent crude at the beginning of today's trading day was close to the level of 61.00 dollars per barrel.
Nevertheless, at the beginning of today's European session, the price is close to 62.00, through which there is a strong short-term resistance level (200-period moving average on the 1-hour chart).
Since the opening of the trading day, the price has risen by 1.00 dollars. Nevertheless, it is highly likely that on the eve of the meeting of the Organization of Petroleum Exporting Countries (OPEC) at the end of this month, prices may remain in the range. It is expected that the meeting will extend the deal to reduce oil production.
As the UAE oil minister said earlier this week, "there is a potential for extending the deal to cut production in order to reduce the surplus on the market." "We are not satisfied that the price of oil for the year increased from 40 to 64 dollars per barrel, and we will discuss the terms of the extension of the agreement," the minister added.
Today (17:00 GMT), the report of the Baker Hughes oilfield services company on the number of active drilling platforms in the US, which is an important indicator of the activity of the oil sector of the US economy, will be published and significantly affects the quotations of oil prices. The current value of the indicator is 738 active drilling rigs.
If the number of drilling rigs increases, this will indicate the next recovery of oil production in the United States. The maximum number of active drilling in this year was recorded in August (768 units).
*)An advanced fundamental analysis is available on the Tifia Forex Broker website at tifia.com/analytics
Support and resistance levels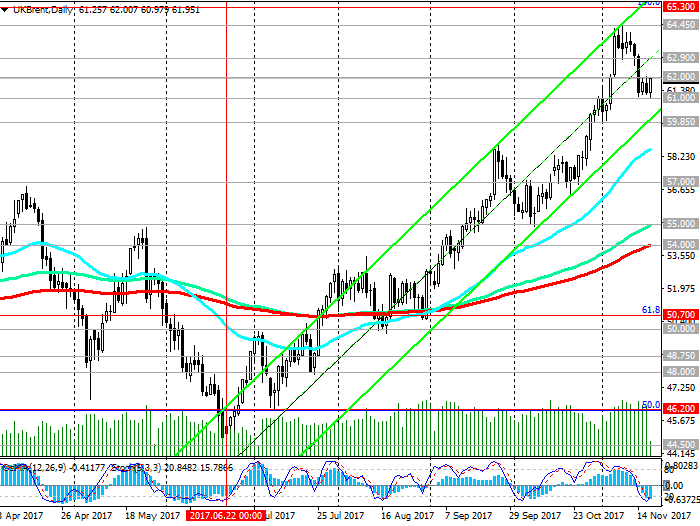
A strong positive impulse of a fundamental nature remains in force and keeps prices from a deeper decline. The current decrease should be considered so far as correctional.
In case of resumption of growth, the nearest target will be resistance level 62.90 (EMA200 on the monthly chart). The growth above the level of 65.30 will indicate a full recovery in prices after falling from the level of 65.30 in June 2015 to the absolute minimums of 2016 near the 27.00 mark.
If the decline resumes, then up to the support level of 59.85 (EMA200 on the 4-hour chart), it should still be considered only as a correction in the uptrend.
Long positions are preferred.
Consideration of short medium-term positions is possible after the price returns under support level 59.85. The first signal for the opening of short positions will be the breakdown of the short-term support level of 61.00 (EMA200 on the 1-hour chart).
The medium-term targets in this case will be the support levels of 55.00 (EMA200 on the weekly chart), 54.00 (EMA200 on the daily chart), 50.70 (Fibonacci level 61.8%) 50.00 (August lows), 48.75, 48.00 , 46.20 (Fibonacci 50%), 44.50 (lows of the year), 41.70 (the Fibonacci retracement level of 38.2% of the correction to the decline from the level of 65.30 since June 2015).
Support levels: 61.00, 60.00, 59.85, 58.80, 58.00, 57.00, 56.20, 55.55, 55.00, 54.00, 53.50, 52.20, 50.70, 50.00
Resistance levels: 62.00, 62.90, 64.00, 64.45, 65.00, 65.30, 66.00

Trading scenarios
Sell Stop 60.80. Stop-Loss 62.20. Take-Profit 60.00, 59.85, 58.80, 58.00, 57.00, 56.20, 55.55, 55.00, 54.00, 53.50, 52.20, 50.70, 50.00
Buy Stop. 62.20. Stop-Loss 60.80. Take-Profit 62.90, 64.00, 64.45, 65.00, 65.30, 66.00
*) For up-to-date and detailed analytics and news on the forex market visit Tifia Forex Broker website tifia.com


")