
96.8% NZDJPY will close this Week with a Weekly Bullish Candle!
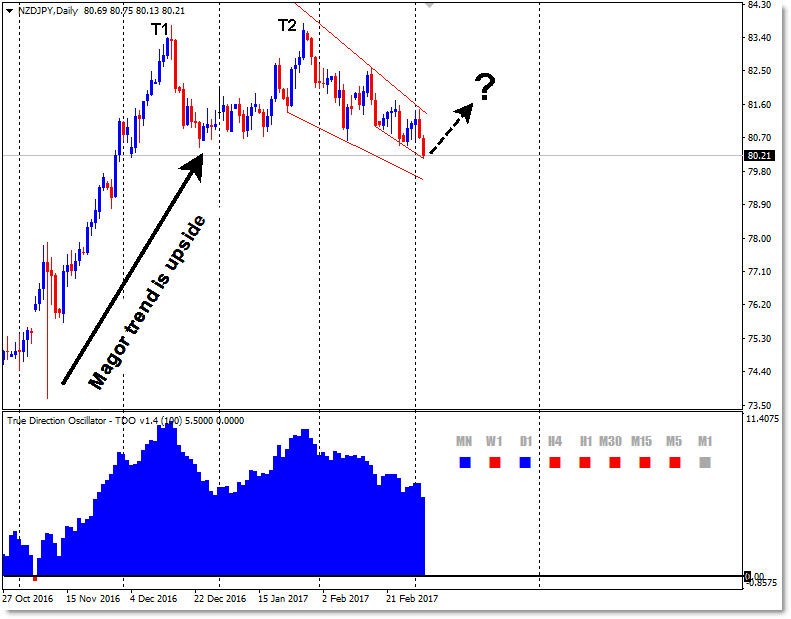
NZDJPY currency pair formed a Double Top classic chart pattern, where first top (T1 on the chart) is 2016 yearly peak and second top (T2 on the chart) is 2017 peak until now.
The currency pair break down the Double Top chart pattern neckline to the down side, which make some traders believe that NZDJPY had begun a new downside trend, but I don't think so because:
1. The major trend is still to the upside.
2. Momentum of the current direction measured with "True Direction Oscillator (TDO)" is still strong bullish.
3. No divergence appeared on TDO between top one and two of the formation.
NZDJPY is now moving inside a Descending Wedge classic chart pattern and it did not break outside it yet.
I believe that NZDJPY have a very high probability to break in the upside direction in the next week, at another attempt to move back in the direction of the main trend.so let us watch the market next week to see what will happen.


")
![[XAUUSD]: Weekly Liquidity Activation Points (timings), June 22-26, 2026](https://c.mql5.com/6/1013/splash-preview-771790.png "[XAUUSD]: Weekly Liquidity Activation Points (timings), June 22-26, 2026")
")