
G’day, forex mates! Another RBA statement is heading our way this Tuesday (July 5, 4:30 am GMT), so get up to speed on how the Australian economy is faring by reading up on another edition of my Economic Snapshot.
Note: Like all my other Economic Snapshots, there are nifty tables at the bottom, so you can skip to those if you’re a forex trader who’s in a hurry. The bullet points provided highlight the underlying details and trends that give the numbers their proper context, however.
Growth
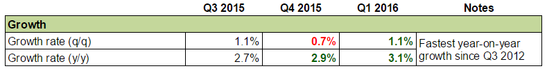
- Australia’s GDP expanded by 1.1% quarter-on-quarter in Q1, which is much faster than than Q4’s upwardly revised 0.7% growth (0.6% originally).
- This is the fastest quarter-on-quarter expansion since Q1 2012.
- Year-on-year, GDP grew by 3.1% in Q1 2016, which is better than Q4’s 2.9% (revised lower from 3.0%).
- This is the fastest year-on-year expansion since Q3 2012.
- Also, annual GDP has been growing at an ever faster pace for three consecutive quarters now.
- Trade was the main driver for the significant pick up in quarter-on-quarter GDP growth.
- Exports and imports effectively cancelled each other out in Q4 2015, but exports expanded by 4.4% while imports contracted by 0.8% in Q1 2016, so net trade had a positive contribution of 1.2% to quarter-on-quarter GDP growth.
- Household spending was robust and is still the backbone of the Australian economy since it expanded further by 0.7% (0.7% previous), adding 0.4% to quarter-on-quarter GDP growth, which is the same contribution as in the last three quarters.
- Private investment in non-residential buildings is still the major drag, dropping further by 7.7% (-7.0% previous) and subtracting 0.5% from quarter-on-quarter GDP growth (-0.5% previous).
- Private investment in machinery and equipment was also a drag, sliding by 1.9% and subtracting 0.1% from quarter-on-quarter growth, which is a disappointment because it added 0.1% to GDP growth previously.
- In terms of industrial output, mining output jumped by 6.2% (+1.1% previous), and the mining industry ended up being the main contributor, adding 0.5% to quarter-on-quarter GDP growth (0.1% previous).
- The 1.1% decline in construction (-0.3% previous), meanwhile, is the main drag, subtracting 0.1% from quarter-on-quarter GDP growth.
Employment
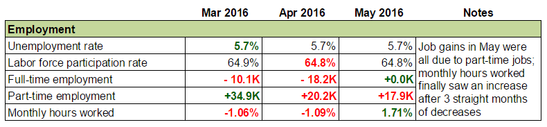
- Australia’s seasonally-adjusted jobless rate held steady at 5.7% in May, which is the lowest reading since September 2013.
- The labor force participation rate ticked was unchanged at the 10-month low of 64.8%.
- Australia saw a net increase 17.9K jobs in May, which is not too shabby, well, until you see that the net gains were ALL from part-time jobs.
- At least full-time jobs were unchanged after two straight months of printing losses.
- The previous reading was also drastically revised lower from a net increase of 10.8K to a measly 0.8K increase, thanks to full-time job losses being revised from 9.3K to a much higher 18.2K loss.
- For what it’s worth, the Australian economy has been gaining jobs for four straight months now after three consecutive months of net losses.
- Part-time jobs generally don’t pay as well as full-time jobs, so the large increase in part-time jobs and stagnant full-time job growth aren’t all that great.
- The seasonally-adjusted monthly hours worked increased by 1.71% to 27.7 million hours, ending three consecutive months of decreases.
- This will hopefully translate to higher earnings and productivity down the road.
Inflation
- No new government inflation data since the May RBA statement.
- Next CPI report will be released on July 27, which is after the upcoming RBA statement.
- For reference, the RBA’s target inflation range is 1-2%.
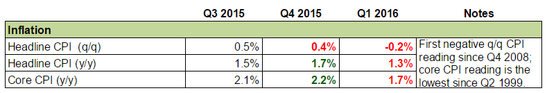
- Q1 2016 headline CPI slid by 0.2% quarter-on-quarter, missing expectations that it will advance by 0.3%.
- This is the first negative quarter-on-quarter headline CPI reading since Q4 2008.
- This also marks the fourth consecutive month that headline CPI has been trending lower on a quarter-on-quarter basis.
- Year-on-year, CPI grew by 1.3%, which is slower than the previous quarter’s 1.7%.
- The annual headline reading is now some distance away from the RBA’s target range of 2.0% – 3.0%.
- Meanwhile, the annual core reading slowed to 1.7%, breaking two consecutive quarters of improving readings.
- This is the lowest annual core reading ever since Q2 1999’s record low of 0.87%.
- On a quarter-on-quarter basis, 6 out of 11 sub-components got hit.
- One of the biggest drags was the transport component, due mainly to the 10% decline in the price of automotive fuel.
Business Conditions & Sentiment
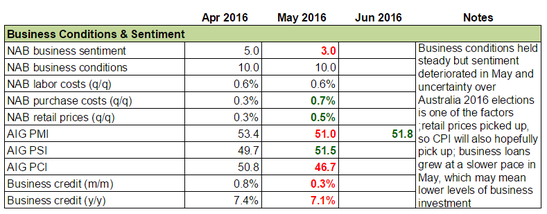
- The National Australia Bank’s (NAB) business confidence index eased for the second straight month to end up at 3 points in May.
- Business sentiment has been positive since September 2013.
- Commentary from the report noted that the drop in business sentiment was likely due to uncertainty over Australia’s 2016 elections.
- However, NAB also speculated that “other factors appear to be at play” since the deterioration in business confidence was concentrated mainly in the manufacturing and transportation industries.
- The deterioration in the above mentioned industries, according to NAB, is “a possible reflection of growing costs as oil and petrol prices continue to gain momentum,” since these two industries would be hit hardest by rising fuel prices.
- The NAB business conditions index held steady at 10 point in May after dipping from an eight-year high of 12 points back in April.
- The steady reading was attributed to improvements in trading conditions and overall profitability.
- The business conditions index held steady in May, a closer look shows that there was some jostling among the industries.
- Business conditions improved in mining, transport, construction, retail and wholesale trade, as well as personal services.
- These were partially offset by deteriorating business conditions in manufacturing, finance, property, and business services.
- The NAB labour costs index showed that wage growth was steady in May, growing by 0.6% quarter-on-quarter, which is the same pace as last time and is relatively restrained.
- Growth in purchase costs accelerated to 0.7% quarter-on-quarter (0.3% previous), but this is still a bit subdued according to NAB.
- Retail prices increased by 0.5% quarter-on-quarter after dipping to 0.3% previously, which is goods since this is “more consistent with the lower bound for the RBA’s inflation target.”
- Overall, NAB concluded that its readings still “remains true to the narrative of an ongoing recovery in the non-mining sectors of the economy.”
- Moving on, the Australian Industry Group’s (AIG) performance of manufacturing index (PMI) recovered a bit to 51.8 in June after sliding for two consecutive months from a multi-year high of 58.1.
- AIG’s performance of services index (PSI) climbed back above the 50.0 stagnation level in May after two straight months of contractions, coming in at 51.5.
- AIG’s performance of construction index (PCI) slumped hard from 50.8 to 46.7 in May, thanks to lower construction activity for apartments, commercial buildings, and engineering projects, but house building remains healthy.
- The higher reading was due to an increase in construction activity brought about by engineering construction activity while housing construction continued to contract, albeit at a slower rate.
- Finally, loans to businesses have been growing for six months running (on a monthly basis).
Business loans in May grew at a slower pace, however, increasing only by 0.3% month-on-month (+0.8% previous). - Year-on-year, business credit has been growing since September 2011.
Like the monthly reading, however, the annual reading also showed a slowdown since it only increased by 7.1% after printing a seven-year high of 7.4% back in April.
Consumer Sentiment & Housing
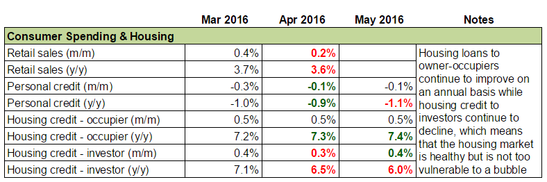
- Retail trade turnover grew at a slower pace in April, growing by 0.2% month-on-month (+0.4% previous) and 3.6% year-on-year (+3.7% previous).
- There’s no discernible trend for the monthly reading, but the annual reading has been growing at a slower pace for two straight months and has been trending lower since November 2015 to boot.
- The year-on-year reading for April is also the slowest increase in six months.
- On both an annual and monthly basis, personal credit has been contracting for five straight months now.
- On a monthly basis, it contracted by 0.1% in May, which is the same pace as last time.
- On an annual basis, it contracted by 1.1%, which is the worst reading since June 2012.
- Housing loans to owner-occupiers continue to grow at a steady 0.5% month-on-month.
- Year-on-year, it grew by 7.4%, which is the faster than the previous month’s 7.3% increase and the fastest pace of growth since August 2010.
- Home loans to owner-occupiers have been growing at an accelerating pace year-on-year since May 2015, which is a good sign that the housing market is healthy.
- As for housing loans to investors, they grew by 0.4% month-on-month, which is a tick higher than the previous month’s 0.3% increase.
- On an annual basis housing loans to investors grew by 6.0% in May, which is a noticeable drop from the previous month’s 6.5% increase.
- The current annual reading is the slowest pace of growth since June 2013.
- Housing loans to investors have been steadily moderating from an annual high of 1.0% back in May 2015, which means that speculative pressure on the Australian housing market continues to ease, reducing the chance of a housing bubble.
- Overall housing credit continued to ease, increasing only 6.9% year-on-year, which is a tick lower than the previous month’s 7.0% increase and is the weakest rate of increase since September 2014 to boot.
Trade
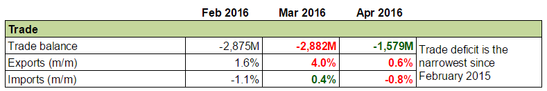
- Australia seasonally-adjusted trade deficit narrowed to around $1,579 million in April.
- That’s in Aussie dollars, by the way.
- Australia hasn’t seen a seasonally-adjusted trade surplus since March 2014, but the current trade gap is the smallest since February 2015.
- The narrower trade deficit was due to exports climbing higher by 0.6% to a seven-month high of $26,734 million while imports contracted by 0.8% to a 16-month low of $28,313 million.
- Rural goods (meat, cereal products, wool, etc.) contributed the most to exports ($171 million), followed by non-monetary gold ($141 million).
- Those were partially offset by the $224 million fall in exports of non-rural goods (iron ore, copper, oil, etc.).
- Imports of goods and services fell, but it’s kinda promising that consumer goods increased by $70 million since that could mean that consumer spending remains robust.
- However, it’s kinda worrying that the $222 million decline in the imports of capital goods was the main reason why imports fell in April, since that could mean that business investment slowed down.
- Regarding export destinations, China is still the main export destination since 31.33% of Australia’s exports made their way to China (32.55% 12-month average).
- Surprising enough, the U.K. is now the third major export destination since 8.50% of Australian exports went to the U.K. in April.
- As a reference, the U.K. market only accounts for around 2.49% of Australia’s exports, based on the 12-month average, which means that the U.K. is usually the 8th or 9th biggest export destination, so the jump is both bizarre and interesting.
- The export value to China and Japan (#2 export destination) have both been declining, but the increase in the U.K.’s share was not just due to that since the export value to the U.K. jumped by 55.19% to $1,673 million (FOB value).
- This is the highest export value to the U.K. since May 2010.
- The export value to the U.K. jumped for the second consecutive month from $310 million back in February to $1078 million in March and now to the current reading.
- For context, the export value to the U.K. has a 12-month average of $501 million and a 24-month average of $401 million.
- Also, the last time export value to the U.K. exceeded $1,000 million was back in December 2011.
Putting it all together
No new government inflation data since the May RBA statement when the poor Q1 inflation readings forced the RBA to downgrade its inflation target range from 2-3% to 1-2%, as stated in their Quarterly Statement on Monetary Policy.
Labor costs held steady, though, while purchase costs and retail prices rose. And those, combined with the jump in number of hours worked, will hopefully translate to higher inflation in Q2. However, retail sales moderated in April while personal loans continue to shrink, which are not good signs for Q2 consumer spending, especially since consumer spending has been the backbone of the Australian economy. But at least the trade deficit in April was the narrowest since February 2015, so that’s a good start for Q2 and maybe trade will be the main driver again, just like back in Q1.
Moving on, the RBA didn’t seem to be all that worried about the Brexit referendum during the June meeting, as revealed by the RBA meeting minutes, and naturally so, since exports to the U.K. historically only account for about 2.49% of Australia’s total exports, so turmoil in the U.K. will sting but won’t directly hurt Australia too much.
However, there was a very interesting jump in export value to the U.K. in March and April, so much so that the U.K. became the third largest export destination in April, accounting for around 8.50% of total exports. Historical data show that there have been jumps in export value to the U.K. once in a while, but it’s rare to see a jump of such magnitude. Not only that, this is the second month running that export value to the U.K. has been way above the 12-month average.
Whether or not this will stick is uncertain, but it’s also interesting that both New Zealand and Australia were very keen on opening trade talks with the U.K. after the pro-Brexit vote. The RBA probably won’t touch on this for now, but if whatever is driving exports toward the U.K. persists, it would mean that Australia has a greater exposure to the U.K. and any Brexit-related events.
As for the housing market, pressure on the housing market continued to ease. It remains to be seen if pressure has eased enough to give the RBA enough room to cut again, though, assuming that the RBA is in the mood to cut rates again, of course.


")
![[XAUUSD]: Weekly Liquidity Activation Points (timings), June 22-26, 2026](https://c.mql5.com/6/1013/splash-preview-771790.png "[XAUUSD]: Weekly Liquidity Activation Points (timings), June 22-26, 2026")
")