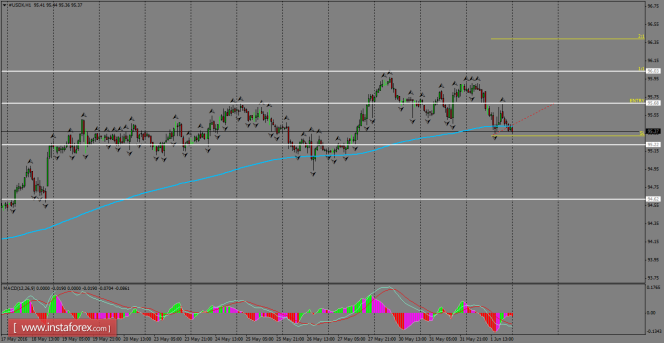
Daily Analysis of USDX for June 02, 2016
USDX is showing weakness on a short-term basis, as it's currently testing the 200 SMA price zone on the H1 chart. However, the next strong support can be found around the 95.22 level, which acted as a barrier for sellers during the May 23th session. If the greenback is able to resume the bullish bias, it can rally toward the 96.35 level.
H1 chart's resistance levels: 95.68 / 96.03
H1 chart's support levels: 95.22 / 94.62
Trading recommendations for today:
Based on the H1 chart, place buy (long) orders only if the USD Index breaks with a bullish candlestick; the resistance level is at 95.68, take profit is at 96.03, and stop loss is at 95.32.
The material has been provided by 


