

Talking Points:
- NZDJPY Technical Strategy: Bearish
- Elliottwave Count: Down Trend resumption for wave3
Pair is having all bearish view in last day of month. As we are only 1 day left in month end and monthly candle is still below the bullish trendline which suggest us a bearish view and keeping bearish bet on trade signal. Here are few charts which are very interesting.
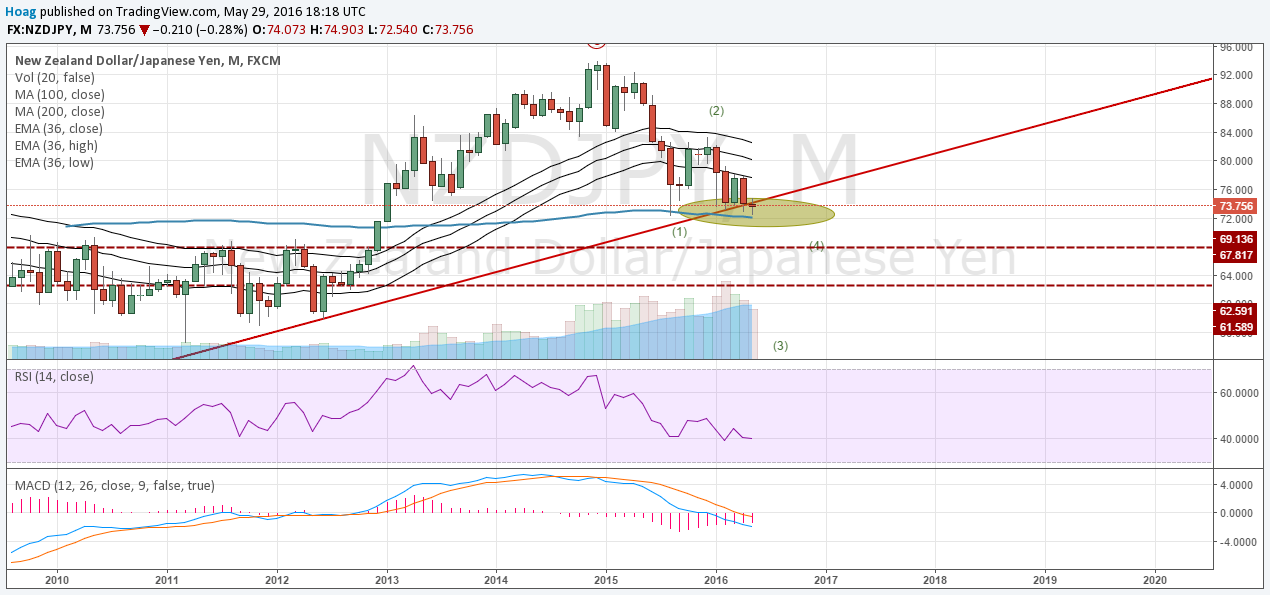
Monthly View:
If below chart confirm month close below the trendline which confirm bearish dark cloud cover and look for more downside in coming days. Wave3 target for this pair is on 67 - 65 range.
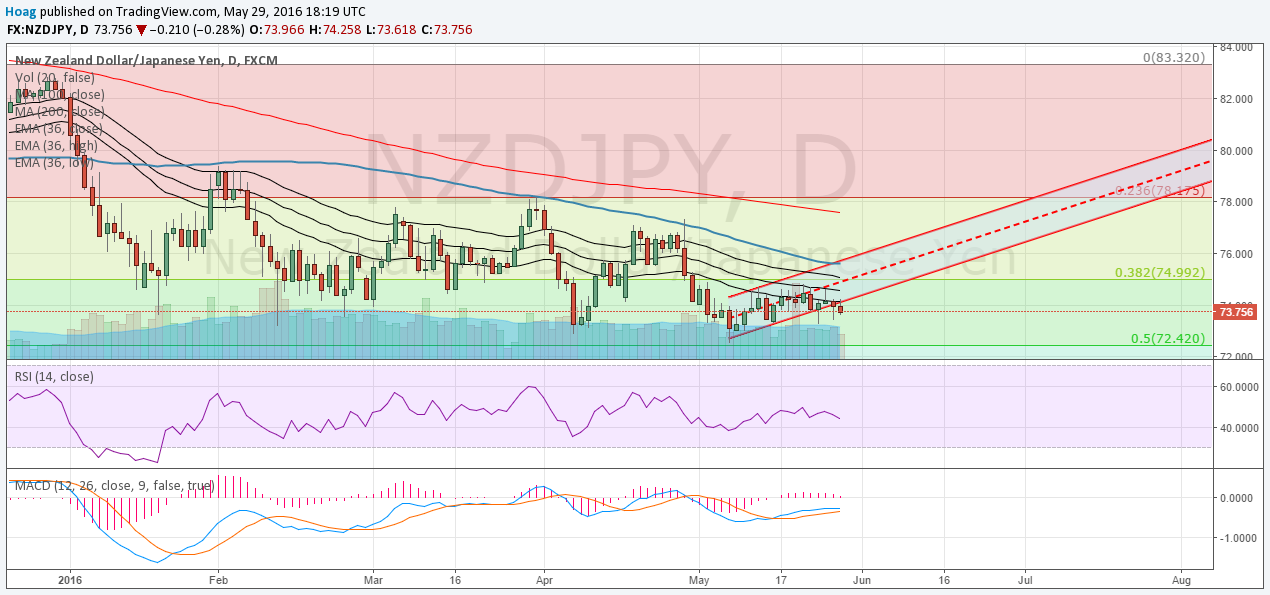
Daily View:
This chart is also interesting as we have evening star confirm evening star pattern, which is reversal pattern on daily chart indicating bearish view. Also same time, pair is able to close out of bullish corrective channel, This is boosting our bearish view.
Hourly View:
This chart is on 1 hours period but having very interesting data to observe. Pair created bearish candle and waiting for break on bullish trendline. So in this case, we are expecting gap down below the bullish trendline and want to see below 73 levels on opening 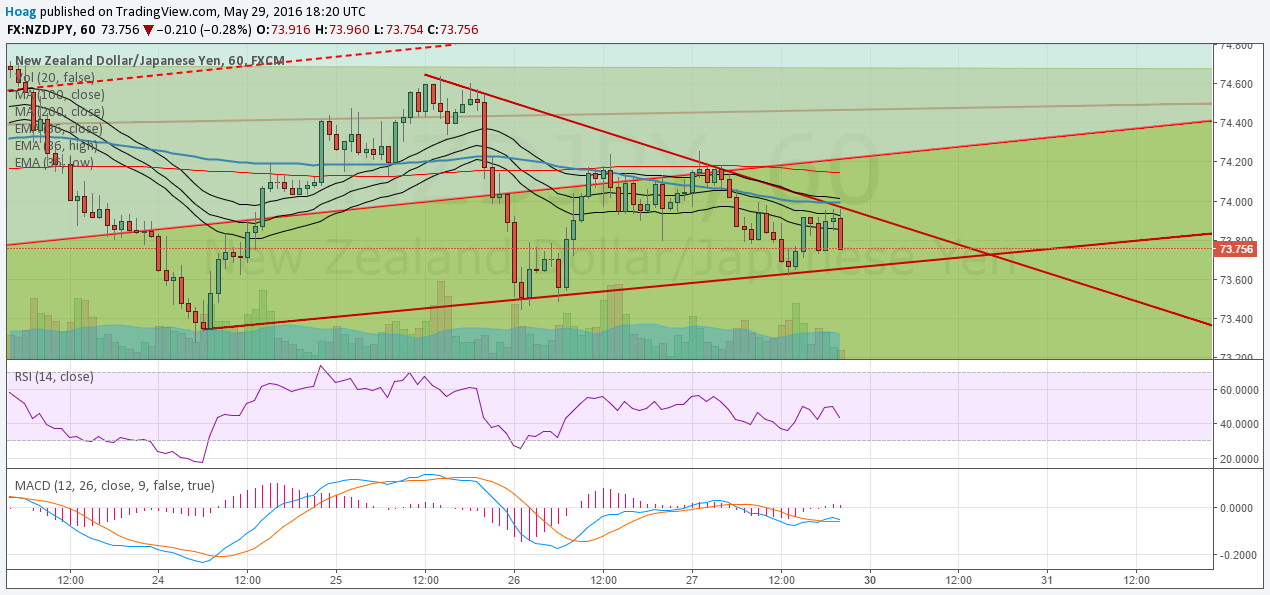 session.


")