XAU/USD: Further Decline in the Pair was Stopped by Support Level of 1248.00 - Technical analysis of 20.05.2016
XAU/USD: Further Decline in the Pair was Stopped by Support Level of 1248.00 - Technical analysis of 20.05.2016
Review and dynamics
Since the beginning of this year the price of gold has been growing. Currently the price of gold has approached the level of 1300.00 USD per ounce due to uncertainty in the global financial market and decline in the economic growth in the world. The rise in price has been the highest in the past 30 years.
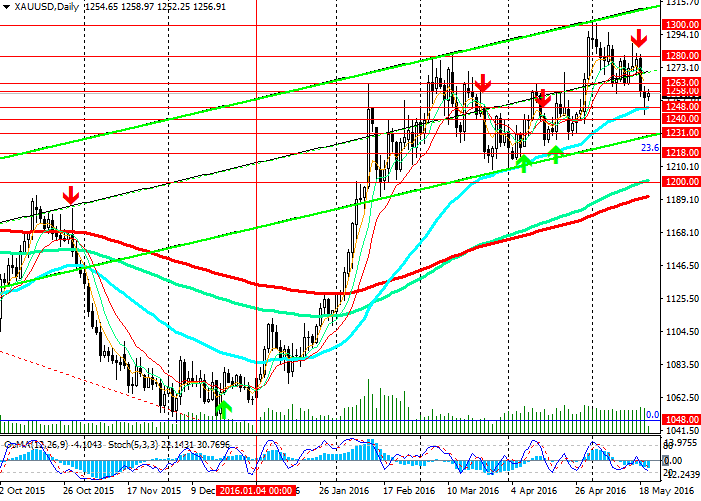
However, since the beginning of this month the price started to decline. The decline accelerated on Wednesday after the release of the minutes of the FOMC meeting. From the level of 1300.00, the price fell by 50 USD per ounce, still remaining gin the ascending channel on the daily and weekly channels with the upper limit between the levels of 1300.00 and 1323.00 (Fibonacci 38.2% to the wave of decline since October 2012).
Our opinion
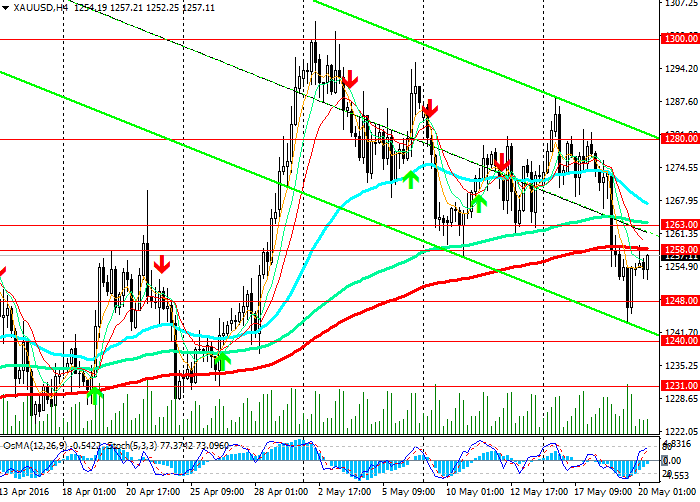
On the daily chart the indicators OsMA and Stochastic are giving sell signals, while the indicators on the weekly chart suggest to open short positions. The price consolidated below support level of 1258.00 (ЕМА200 on 4-hour chart). In case of breakdown of support levels 1248.00 (ЕМА50 on the daily chart), 1240.00 (ЕМА144 on the weekly chart), the pair XAU/USD the pair will go to support levels of 1218.00 (Fibonacci 23.6%) and 1200.00.
After consolidation of the price below the 1200.00, the pair can resume downtrend. In this case, opening of the medium-term short positions in the pair XAU/USD will be advisable.
As an alternative scenario the pair can go up in the ascending channel on the weekly chart with the target of 1300.00 and 1323.00 (Fibonacci 38.2%). The rise in the pair may take place if the price consolidates above the level of 1263.00 (ЕМА144 on 4-hour chart) and in case of support of the indicators on 4-hour and daily charts.
Support levels: 1248.00, 1240.00, 1231.00, 1218.00 and 1200.00.
Resistance levels: 1263.00, 1280.0 and 1300.00.
Trading tips
Buy Stop: 1265.00. Stop-Loss: 1252.00. Targets: 1280.00, 1300.00, 1323.00, 1360.00 and 1385.00.
Sell Stop: 1250.00. Stop-Loss: 1265.00. Targets: 1240.00, 1231.00, 1218.00, 1210.00 and 1200.00.

Pullback from the level of 1248.00
In the descending channel


