

As we wrote on Friday, ES-Mini: Tough Support; It Might Bounce!, we expected the market to start bouncing around the 2030 support region and completed the first corrective wave (A or 1) down from the highs.
ES-Mini 1H Chart - May 9, 2016
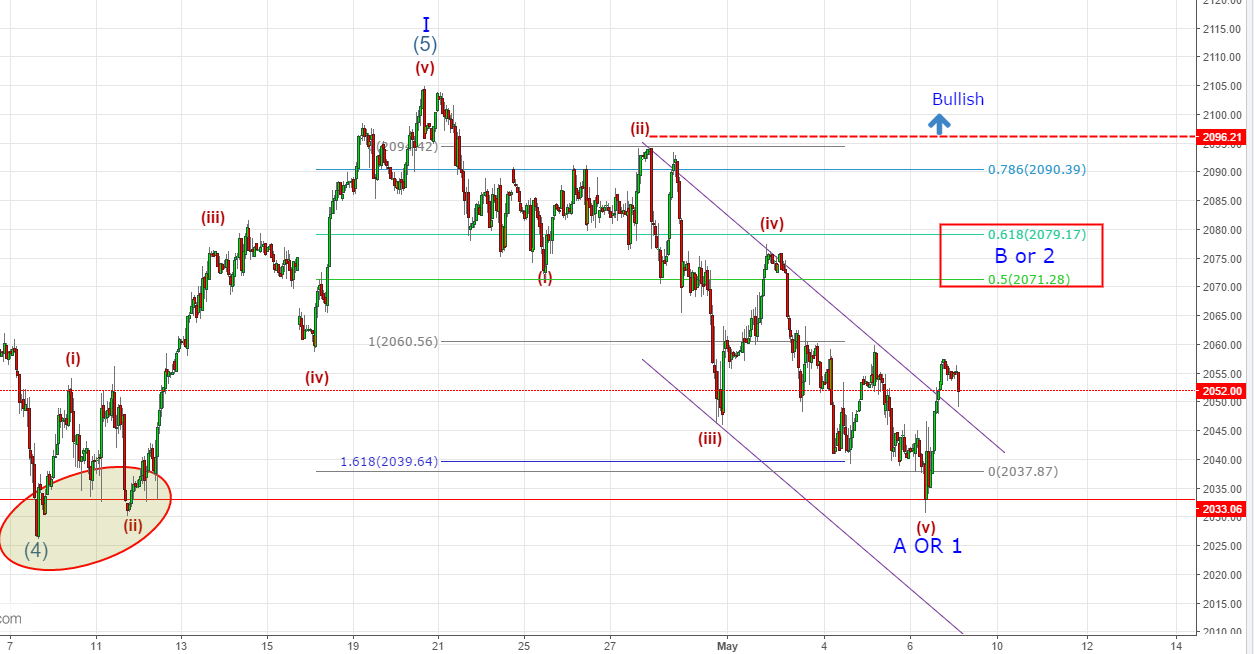
We bought at 2030 last Friday and closed at 2050, right in the first candle above the upper-bound of the channel.
In order for another impulsive move towards 2070-2080, which are the 50% and 62% retracement levels, we will need to see a pullback towards the 2040-2045 area that needs to hold the previous low.
Above 2080 ...Read More


 & AMD Framework")
")