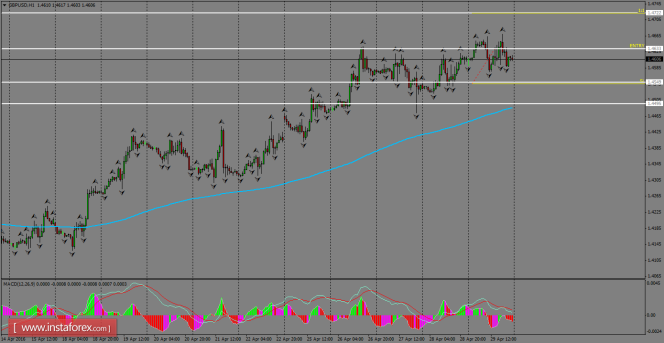
Daily Analysis of GBP/USD for May 02, 2016
GBP/USD has been dealing with the strong resistance around the 1.4633 level, in which a breakout could produce another rally to reach new lows, possibly toward the 1.4722 level, which is a key level for sellers, who are highly active. Another scenario could be telling us about a possible pullback to test the 200 SMA, before the pair performs further rebounds in favor of the bullish side.

H1 chart's resistance levels: 1.4633 / 1.4722
H1 chart's support levels: 1.4549 / 1.4495
Trading recommendations for today:
Based on the H1 chart, place buy (long) orders only if the GBP/USD pair breaks a bullish candlestick; the resistance level is at 1.4633, take profit is at 1.4722 and stop loss is at 1.4546.
The material has been provided by InstaForex Company - www.instaforex.com


