Daily Analysis of USDX for April 27, 2016
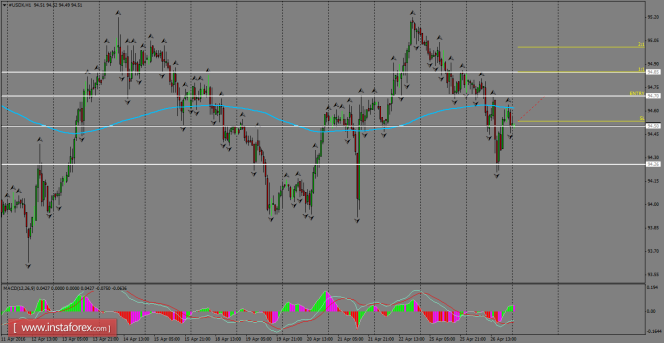
USDX has been doing strong declines from the April 22th highs, and now we're seeing a strong rebound above the support level of 94.26. The 200 SMA is currently acting as dynamic resistance and maybe we can expect further downside in coming hours, as the overall structure remains bearish, but in a general picture it's still trapped inside a bearish range.

H1 chart's resistance levels: 94.70 / 94.85
H1 chart's support levels: 94.50 / 94.26
Trading recommendations for today:
Based on the H1 chart, place buy (long) orders only if the USD Index breaks with a bullish candlestick; the resistance level is at 94.70, take profit is at 94.85, and stop loss is at 94.53.
The material has been provided by InstaForex Company - www.instaforex.com


