Brent: Indicators are Leaving Overbought Zone
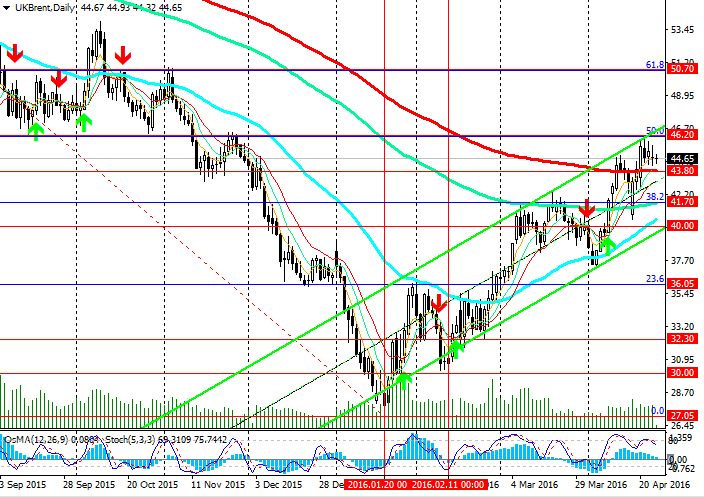
Last week, the price has reached new annual highs at the level of 46.20, which is crossed by the upper limit of the ascending channel on the daily chart and Fibonacci 50% (correction to the decline since June 2015 and the level of 65.30 to the lows of 2016 at the level of 27.05), and ЕМА50 on the weekly chart. Therefore, the price has reached strong resistance level of 46.20, which will be difficult to break out without support from the strong fundamental data.
On the other hand, current fundamental data may trigger downward movement in the pair (see Fundamental analysis).
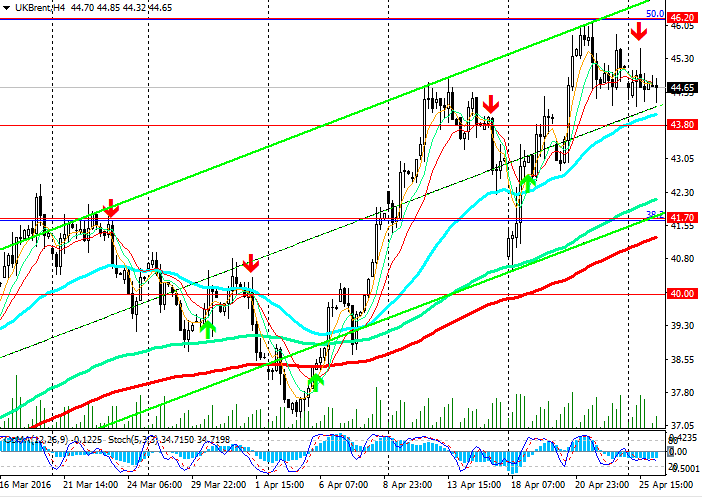
On 4-hour chart the indicators OsMA and Stochastic give sell signals; on the daily chart the indicators are also reversing towards the short positions. Breakout of support level of 43.80 (ЕМА200 on the daily chart) will bring the pair to the level of 41.70 (Fibonacci 38.2% and ЕМА144 on the daily chart). Consolidation of the price below the level of 40.00 (lower line of the channel on the daily chart) may trigger further decline to 36.05 (Fibonacci 23.6%), 30.00 and the lows of the year at the level of 27.00 USD a barrel.
The rise in the pair will be possible after breakout of the level of 46.20. The pair may go up to the level of 50.70 (Fibonacci 61.8% and the highs of November 2015).
Support levels: 43.80, 41.70, 41.00, 40.00 and 36.05.
Resistance levels: 46.00, 46.20 and 47.00.
Trading tips
Sell Stop: 43.70. Stop-Loss: 44.10. Take-Profit: 42.15, 41.70, 41.00, 40.00 and 36.05.
Buy Stop: 45.60. Stop-Loss: 44.20. Take-Profit: 46.00, 46.20, 47.00 and 50.00.


