Technical Analysis of USDX for April 26, 2016
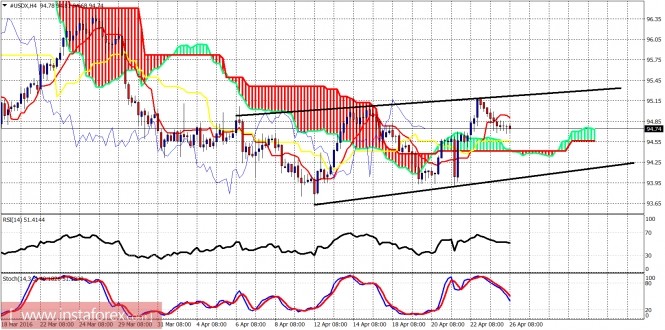
The Dollar index continued its slide lower yesterday towards the 94.40 support. The price is steadily pushing lower towards the short-term support. The trend is mainly neutral as the price has been moving sideways for several days now, unable to break out of the 94-95.20 trading range.

Black lines - sideways channel
The Dollar index is heading towards the 4-hour Kumo (cloud) support at 94.40. The lower channel boundary support is at 94. The trend is bearish in the short term as long as the price is below the 95.20 resistance. Stochastic is negatively sloped and this favors the continuation of the decline.

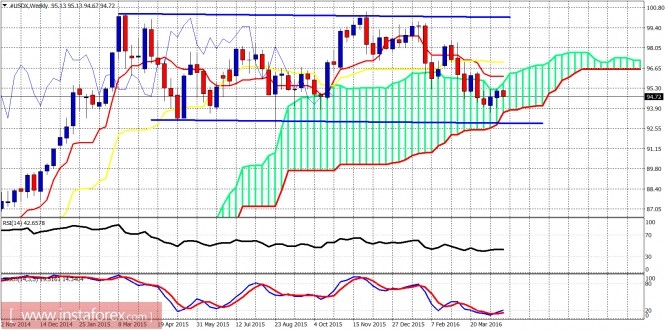
Blue lines - trading range
On the weekly chart above, the price is still trading inside the Kumo and is holding above the lower cloud boundary. Stochastic is oversold and turning upwards so traders should prefer to avoid short positions in the index. Weekly resistance is at 96.10. The bigger picture remains unchanged. The price is moving sideways for at least a year in what it seems to be a big consolidation before the next big bullish Dollar move.
The material has been provided by InstaForex Company - www.instaforex.com


