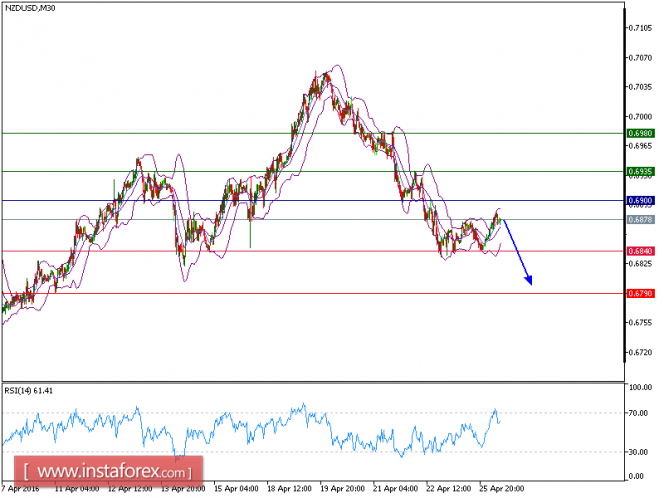
Technical Analysis of NZD/USD for April 26, 2016

NZD/USD is indicating choppy price action with a bearish bias. The pair remains under pressure below its key resistance at 0.6900 and is looking for a lower bottom. The intraday technical indicators are mixed to bearish. Even though a continuation of the consolidation cannot be ruled out, its extent should be limited. The first target to the downside is therefore set at 0.6840. A break below this level would open way to further weakness toward the horizontal support at 0.6790.
Trading recommendations:
The pair is trading below its pivot point. It is likely to trade in a lower range as long as it remains below the pivot point. Short positions are recommended with the first target at 0.6840. A break of this target will move the pair further downwards to 0.6790. The pivot point stands at 0.6900. In case the price moves in the opposite direction and bounces back from the support level, it will move above its pivot point. It is likely to move further to the upside. According to that scenario, long positions are recommended with the first target at 0.6935 and the second target at 0.6980.
Resistance levels: 0.6935, 0.6980, 0.7025
Support levels: 0.6840, 0.6790, 0.6775
The material has been provided by InstaForex Company - www.instaforex.com


