Daily Analysis of USDX for April 19, 2016
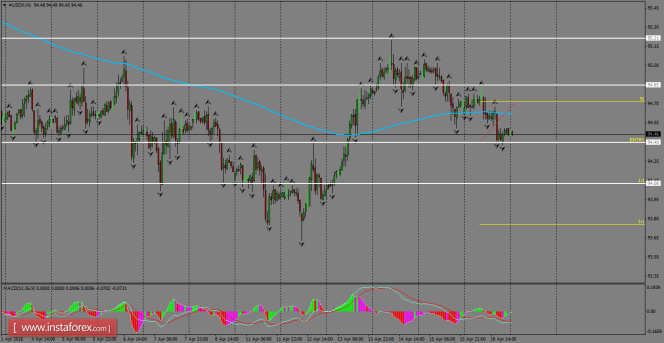
On the H1 chart, USDX is finding strong support around the 94.40 level, where a lower low pattern is being formed in order to reach new lows. A breakout should be expected below the 94.40 level in order to reach the short-term target around the 94.08 level. That bearish scenario should be invalidated when the Index does a consolidation above the April 14th highs.

H1 chart's resistance levels: 94.85 / 95.21
H1 chart's support levels: 94.40 / 94.08
Trading recommendations for today:
Based on the H1 chart, place sell (short) orders only if the USD Index breaks with a bearish candlestick; the support level is at 94.40, take profit is at 94.08, and stop loss is at 94.72.


