Technical Analysis of USDX for April 6, 2016
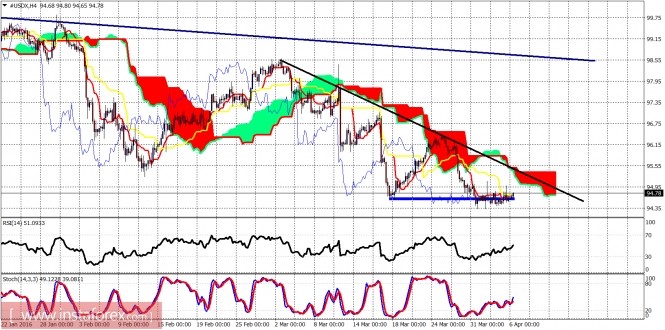
The Dollar index continued its sideways movement with no clear direction. The trend remains bearish. Dollar bears should better wait for a bounce before selling right away. Dollar bulls should be patient as the short-term trend remains bearish.

Black line - trend line resistance
Blue area - support zone
The Dollar index remains in a bearish trend as the price is still below the 4-hour Kumo (cloud). The price is trading around the 94.50 support but there is still no breakdown. We could see a bounce towards 95 which is the short-term resistance lowered as days go by and the price moves sideways.

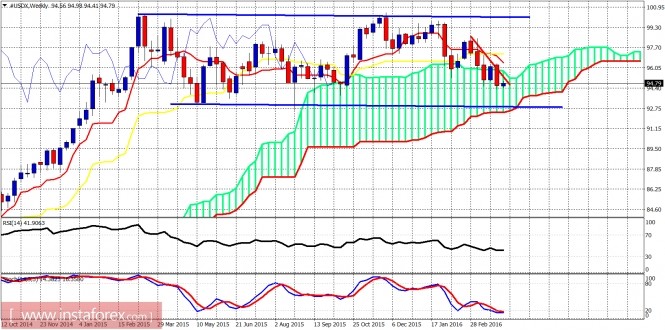
Blue lines - trading range
The weekly chart shows how the price remains trapped inside the trading range. The short-term trend is bearish as the price has entered the Kumo (cloud). Support is at 93 at the lower boundary of the Kumo and the lower range boundary. The bigger trend is neutral as the price remains trapped in this big range.
The material has been provided by InstaForex Company - www.instaforex.com


