S&P500: Positive Dynamics Continues
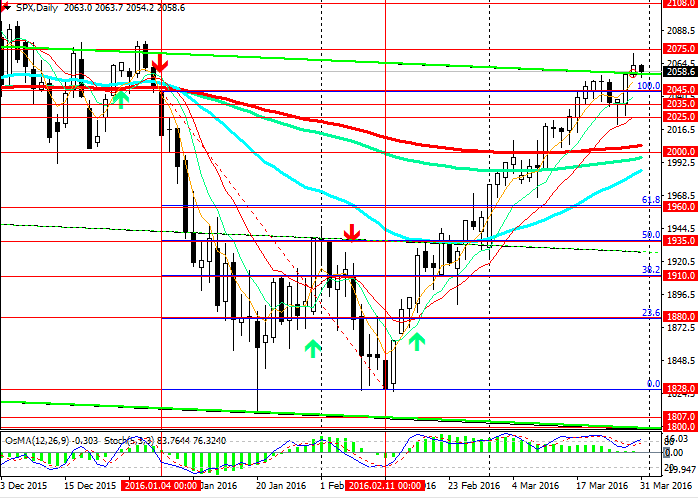
On Tuesday the index S&P500 has broken down resistance level of 2045.0 (Fibonacci 100% in the decline since the beginning of 2016). Positive dynamics continues. Mrs. Yellen’s comments about gradual increase in the interest rate in the USA have supported risky assets and stocks and, at the same time caused the decline in the USD against the other currencies.
On Thursday since the opening of the Asian session the index S&P500 undergoing downward correction amid profit taking and in anticipation of the data on NFPR tomorrow.
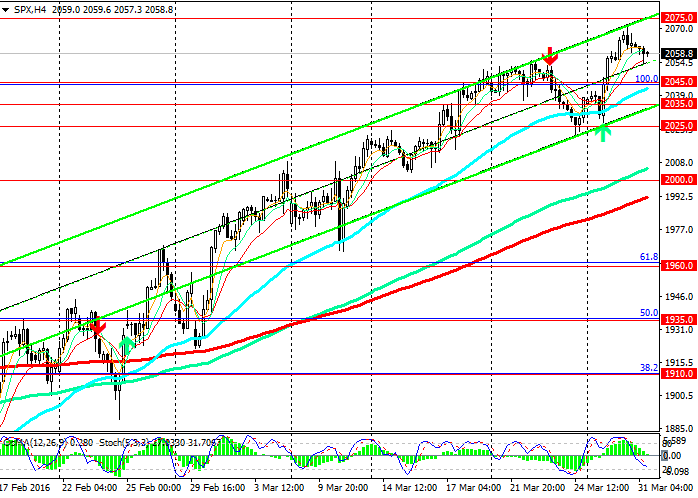
On 4-hour chart the indicators OsMA and Stochastic have reversed toward the short positions; however, on the daily and weekly charts the indicators give buy signals, which is an indication of correction in the uptrend and in the channel on the 4-hour chart.
Downward correction will be probably short-term. The price may decline to 2045.0 (Fibonacci 100% and ЕМА50 on 4-hour chart), 2035.0 (lower line of the ascending channel).
The price can return to the downtrend only after consolidation of the price below the level of 2000.0 (ЕМА200, ЕМА144 on the daily chart).
Breakout of the resistance level of 2070.0 (recent highs), 2075.0 (upper limit of the ascending channel) may trigger further rise in price.
Support levels: 2045.0, 2035.0, 2025.0 and 2000.0.
Resistance levels: 2070.0, 2075.0 and 2100.0.
Trading tips
Sell Stop: 2048.0. Stop-Loss: 2060.0. Targets: 2045.0, 2035.0, 2025.0 and 2000.0.
Buy Stop: 2070.0. Stop-Loss: 2050.0. Targets: 2075.0, 2090 and 2100.0.


The material has been provided by LiteForex - Finance Services Company - www.liteforex.com


