

*All signals provided for informational purposes only. The time period from 7 to 14 days depending on the situation on the currency market. Schedule-daily.
AudUsd:sell Signal. The graph shows the nearest levels of support and resistance.
If the level of support 0.7467 broken to strengthen the bearish trend to the level 0.7315.
A serious level of level of resistance around 0.7675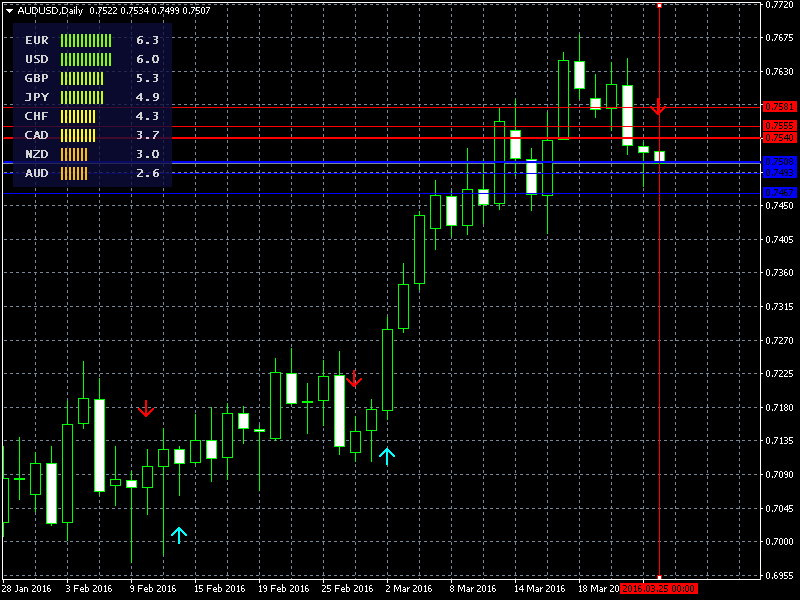
Copy signals, Trade and Earn $ on Forex4you - https://www.share4you.com/en/?affid=0fd9105
The GbpUsd:
Signals copy, distribute and earn $ on https://www.share4you.com/ru/?affid=0fd9105
The sell signal. The graph shows the nearest levels of support and resistance.
The last candle close on Friday confirms the possible continuation of the bearish trend. Plus, the couple will press political risks(Brexit).
The break through the level 1.4006 will indicate further movement.
A serious level of level of resistance around 1.4375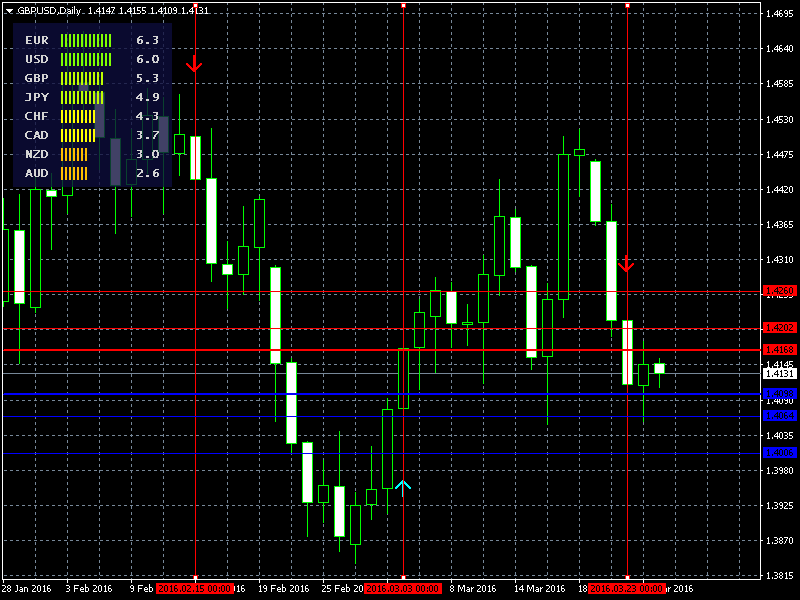
The UsdCad:
A buy signal. The graph shows the nearest levels of support and resistance.
Steam is very dependent on oil prices and there are risks for Cad.
The breaking through the level of 1.3333 will increase the strength of the bearish trend. The main driver for the pair is the oil price.
Serious level, the level of support in the area of 1.3045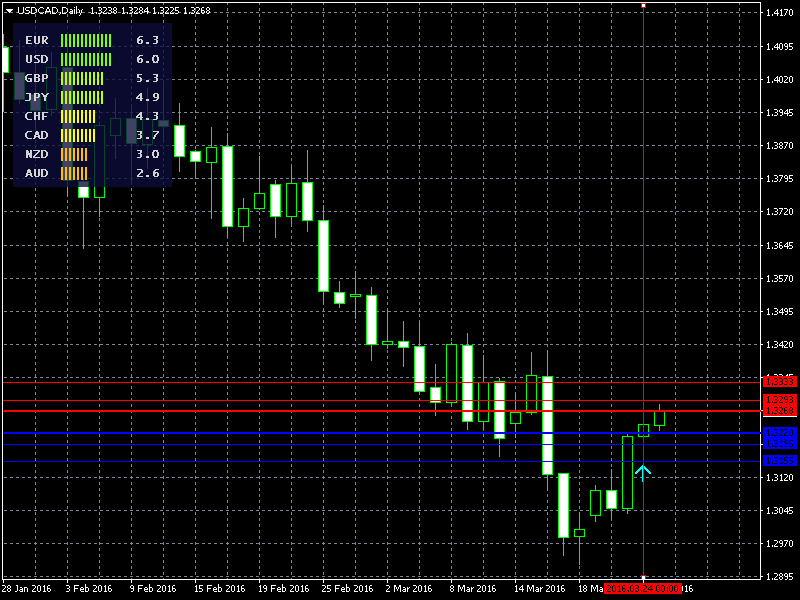
PS: you Should pay attention to a couple of UsdCad and GbpUsd:.


")
