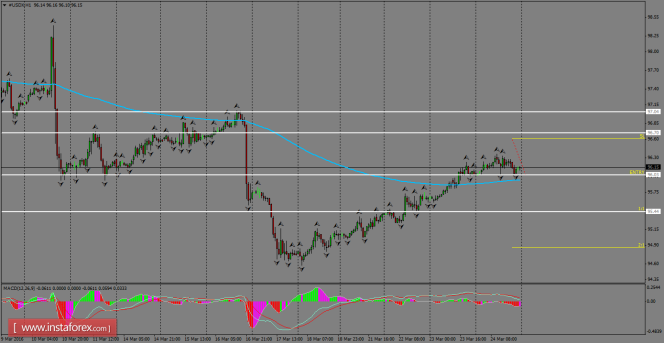
Daily Analysis of USDX for March 25, 2016
On the H1 chart, USDX has been performing a bullish consolidation above the 200 SMA price zone, with a target placed around 96.70 to the upside. However, the downside can be resumed in the coming days because the overall structure in the Index has been bearish and price action is favoring for possible breakous of the latest fractals formed in the corrective move from the March 18th lows.

H1 chart's resistance levels: 96.70 / 97.04
H1 chart's support levels: 96.03 / 95.44
Trading recommendations for today: Based on the H1 chart, place sell (short) orders only if the USD Index breaks with a bearish candlestick; the support level is at 96.03, take profit is at 95.44, and stop loss is at 96.60.
The material has been provided by InstaForex Company - www.instaforex.com


