USDX Technical Analysis for March 23, 2016
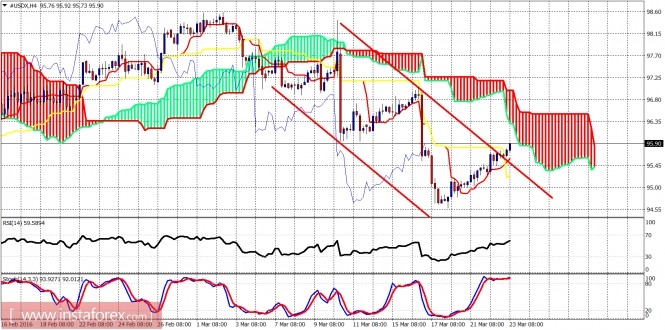
The Dollar index showed renewed strength yesterday and broke out of the short-term bearish channel. Is it a trend reversal? The decline has an overlapping structure which implies we are in a corrective phase. The long-term bullish trend could re-start any day.

Red lines - bearish channel
The Dollar index has started the day in an overbought area so traders should better be patient and look for long positions only after a pull back to 94.55 that is a stop for any long position. Bears should look for short positions at current levels with stops placed at 96.50 level. In the 4 hour chart, price is still below the Kumo and that is why we have no confirmation of a short-term trend reversal.

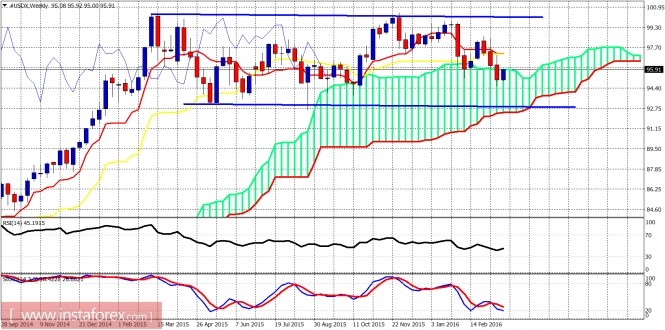
Blue lines - trading range
In the weekly chart, price continues to trade inside the trading range and it is now testing the upper Kumo (cloud) boundary resistance at 96. A daily close above this level could push price over the coming sessions towards the kijun- and tenkan-sen indicators at 97.20. Weekly stochastic is oversold and diverging. I believe the bullish trend that dominated the Dollar index during 2014 will once again resume in order to push the index to new highs.
The material has been provided by InstaForex Company - www.instaforex.com


