Technical Analysis of NZD/CAD for March 21, 2016
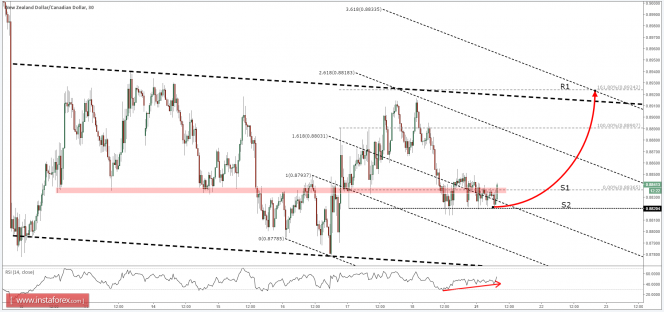
NZD/CAD has been moving sideways for almost two weeks; and this does not seem to be over as the price remains within slightly descending main channel boundaries. The Fibonacci retracement levels of the secondary channel formed at the bottom shows that the price has tested neither 261.8% nor 361.8%, while it broke above the 161.8% level.
The Fibonacci applied to the first corrective wave after the breakout of the secondary channel shows that the nearest potential target at 0.8925, being 161.8% retracement level. It also corresponds with the higher uptrend of the main channel and 361.8% retracement level of the secondary Fib channel.
Consider buying NZD/CAD while the price remains near the 0.8835 support level (S1), targeting the 0.8925 area (R1). The stop loss should be well below S2 (0.8820).
Support: 0.8820, 0.8835
Resistance: 0.8890, 0.8925

The material has been provided by InstaForex Company - www.instaforex.com


