Gold Technical Analysis for March 17, 2016
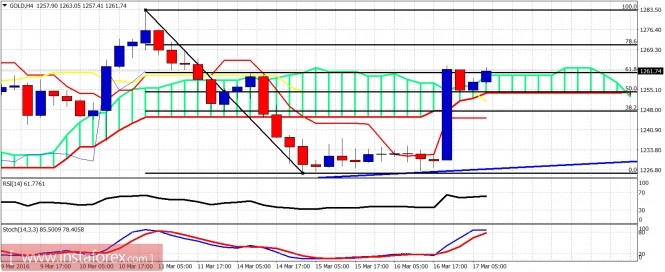
Gold price bounced strongly upwards to our target of $1,245-50 and then, broke even higher after the FOMC meeting last night. Price has reached the 61.8% Fibonacci retracement of a decline from the recent high at $1,283. Bulls need to be very cautious as a bearish reversal is likely to happen.

Gold price bounced strongly towards the Ichimoku cloud resistance and broken above it in the 4 hour chart. This is an important resistance area. This price level is also the 61.8% Fibonacci retracement. This is an important level to watch out for.

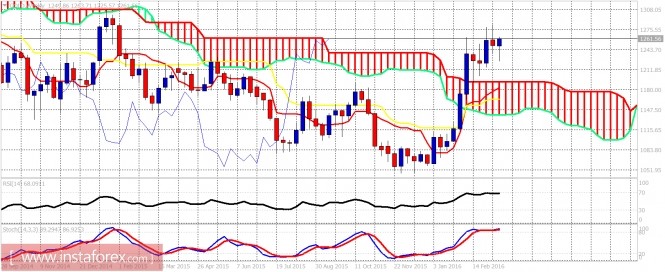
Oscillators in short- and medium-term charts are overbought signaling divergence. Bulls need to be very cautious. A reversal towards $1,200-$1,150 is still expected, if price breaks below $1,225, we will have confirmation of the reversal.
The material has been provided by InstaForex Company - www.instaforex.com


