Technical Analysis of EUR/JPY for March 03, 2016
Technical outlook and chart setups:
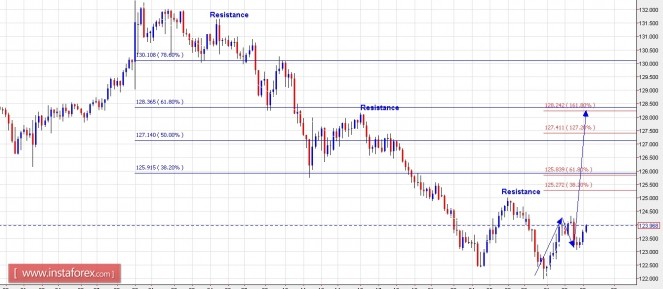
The EUR/JPY pair seems to have formed interim bottom at 123.00 levels yesterday as expected. Please also note that 123.00 is fibonacci 0.50% support level of the rally between 122.00 and 124.30 levels respectively (not depicted here on chart). A push above 124.35 levels would accelerate rally towards 125.80 levels at least. The entire rally could unfold into3 waves and potentially extend through 128.50 levels. On the other side, EUR/JPY can also dip into 122.80 levels, before rallying further. Hence it is recommended to remain long with risk below 122.00 levels for now. Immediate support is seen at 122.00 levels while resistance is seen at 125.00 levels respectively.

General overview for 03/03/2016:
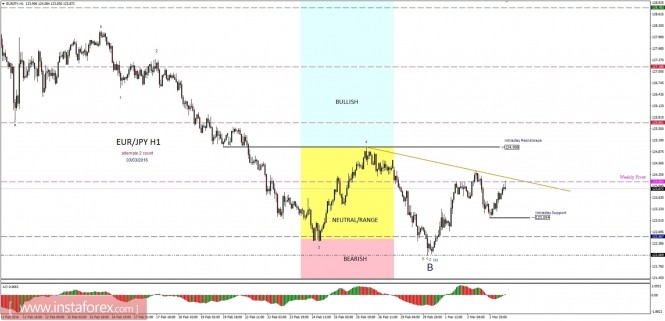
The golden trend line i s still providing the dynamic resistance and bulls must break out above it to confirm the impulsive progression to the upside. The bottom for the wave B blue might be in place and the confirmation of this scenario comes with the level of 125.00 violation. Nevertheless, any violation of the level of 122.06 will invalidate the current labeling and extend the drop downward in wave B blue.

Support/Resistance:
119.43 - WS3
120.96 - WS2
122.56 - WS1
123.09 - Intraday Support
124.05 - Weekly Pivot
125.01 - Intraday Resistance
125.68 - WR1
127.18 - WR2
Trading recommendations:
Remain long for now, stop at 122.00, targets are at 125.80 and 128.50.
Day traders should refrain from trading and wait for a better trading setup to occur in the near term. We will open buy orders when the bottom of the wave B blue is in place, so buy stop orders should be placed at the level of 125.03.
Good luck!
The material has been provided by InstaForex Company - www.instaforex.com


