EUR/NZD Technical Analysis for March 02, 2016
Overview :
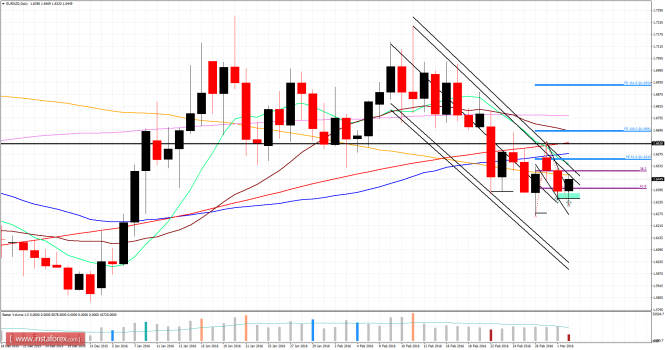
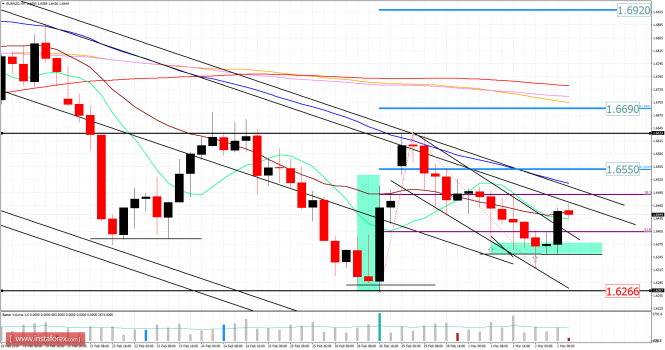
Recently, EUR/NZD has been moving sideways around the price of 1.6450. In the daily time frame, we can observe a supply bar in an average volume, which is a sign of potential strength. Be careful when selling EUR/NZD today since we may see an upward movement. According to the H4 time, I found the strong downward channel. The price found support at the level of 1.6350 (support cluster). If the price breaks our channel to the upside, it may confirm a further upward move. I placed Fibonacci expansion to find potential upward targets. Fibonacci expansion level 61.8% is set at the price of 1.6550, Fibonacci expansion 100% is set at the price of 1.6690 and Fibonacci expansion 161.8% is set at the price of 1.6920. Major support from the other side is set at the price of 1.6265.


Fibonacci Pivot Points:
Resistance levels:
R1: 1.6475
R2: 1.6510
R3: 1.6565
Support levels:
S1: 1.6365
S2: 1.6335
S3: 1.6275
Trading recommendation for today: Watch for potential buying opportunities on dips.
The material has been provided by InstaForex Company - www.instaforex.com


