

Identifying turning points in the market can be a daunting task. If you are already in a position, it’s easy to let your emotions take over and throw your larger goal out the window in favor of smaller, more immediate returns. Often, this is the wrong approach and you will stand on the sidelines as prices continue to rise or fall in accordance with your initial bias as you mentally slap yourself for your lack of discipline.
When your instincts are telling you that the odds are in your favor, why is it so difficult to just stay the course? For most, the reason boils down to confidence. While the seeds of confidence are often sown in instinct, it is reason that nurtures your ability to trust those instincts.
Identifying turning points in the market can be a daunting task. If you are already in a position, it’s easy to let your emotions take over and throw your larger goal out the window in favor of smaller, more immediate returns. Often, this is the wrong approach and you will stand on the sidelines as prices continue to rise or fall in accordance with your initial bias as you mentally slap yourself for your lack of discipline.When your instincts are telling you that the odds are in your favor, why is it so difficult to just stay the course? For most, the reason boils down to confidence. While the seeds of confidence are often sown in instinct, it is reason that nurtures your ability to trust those instincts.
The greatest key to building confidence and hanging onto winning positions longer is to have a solid target and exit strategy in place before initiating a trade. The majority of traders try to improve their odds of correctly identifying these targets through the use of indicators. Most indicators, however, are only as good as the trader using them and correct applications and interpretations can take years to master.
A disconcerting fact for those studying market indicators is that there are relatively few that can assist in all aspects of trade management. One exception is a form of market analysis that we know today simply by the name of the author who is credited for introducing the system’s underlying numerical sequence to the West: Fibonacci.
Sweet sequence
Fibonacci indicators that have become popular in technical analysis today are based upon ratios that are derived from the numbers that make up the “Fibonacci sequence.” This sequence is the result of adding each new number to the one that precedes it, beginning with 0 and 1. For example: 0+1=1, 1+1=2, 1+2=3, 2+3=5, 3+5=8, etc.
After the first several numbers, an interesting symmetry begins to develop. For example, from 13 onward, every time you divide a number by the one to the right of it, the result is 0.618. When you divide a number by the one two places to the right, the result is 0.382. These numbers are converted by market analysts into 61.8% and 38.2% respectively.
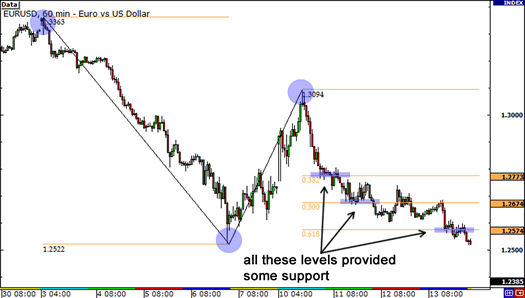
The significance of the Fibonacci numbers and resulting ratios is a topic that has been debated widely over the years. While scholars argue the veracity of many claims that Fibonacci is part of the underlying fabric of natural design, in the financial markets it is the skeptics that often take a back seat. Support and resistance levels based on Fibonacci numbers and ratios hold remarkably well when applied to chart analysis. This is true especially for forex and futures markets and in individual, high-volatility securities.
There are numerous applications for Fibonacci ratios in technical analysis. Among the most popular are Fibonacci retracement levels, price and time extensions and Fibonacci fans. While these tools transcend markets, they also transcend time frames and are viable for traders and investors alike.
Simple application
A trading minimalist can appreciate the simplicity of relying on pure price action to decide how to place and manage a trade. Many popular indicators simply create clutter and confusion, eroding confidence as opposed to bolstering it as the market landscape shifts and trends change. Fibonacci, on the other hand, is rather exceptional. It works well in both a trending market and in periods of congestion.
Although learning a new system of market analysis might seem daunting, and the plethora of Fibonacci applications can make some traders shy away, many Fibonacci techniques are surprising simple to use and are relatively foolproof. Perfection is not necessary.
A Fibonacci expansion is a type of extension tool that relies on three price points instead of the typical two you will find when using Fibonacci retracements. The first two anchor points in a three-point expansion are based on a primary trend move, otherwise known as an “impulse wave,” in a futures, currency or security.
In an uptrend, the first anchor point is the low of the uptrend. This is shown as “A” in the accompanying charts. After selecting the Fibonacci expansion tool in your charting platform, click on this first low to begin the expansion. Next, click on the high of the impulse wave. This is shown as “B” in the accompanying charts. The third point, marked “C,” anchors the expansion move itself.
Consider a trade in the E-mini Dow futures as an example. This trade
uses Fibonacci expansions to demonstrate how to identify a target that
developed overnight. The indicated circle in the first chart in
“Expanding opportunity” (below) shows an early buy trigger that was
missed, while the circle in the second chart shows an entry zone caught
later that morning after the Fibonacci expansion was re-applied.
Many traders struggle with drawing Fibonacci levels properly, but even levels that are not drawn ideally will yield strong support and resistance points. Indeed, if you pick a number of random highs and lows in a security on which you base Fibonacci levels, many of the resulting horizontal lines cluster together at certain price zones. These clusters are what traders use to distinguish major from minor support and resistance.
Fibonacci expansion works well for establishing price targets. When a trader can place a target level on a chart visually, holding for that target point is much easier than simply waiting for an upside move of indeterminate size. By seeing the Fibonacci-based targets hit consistently over time, it makes it even easier to hold positions into those target levels instead of jumping ship too early.
Price points
Fibonacci combines well with other strategies, such as technical price pattern analysis. Typical price patterns in which the Fibonacci expansion tool is particularly useful are continuation strategies such as bull flags, triangles, ABCD patterns, etc. When the momentum of a price move breaking out of these periods of congestion is comparable to the impulse wave heading into them, Fibonacci expansion is most useful. These patterns can create a great deal of choppiness, however, before a breakout occurs. This can lead traders to question whether or not their anchor points are placed properly.
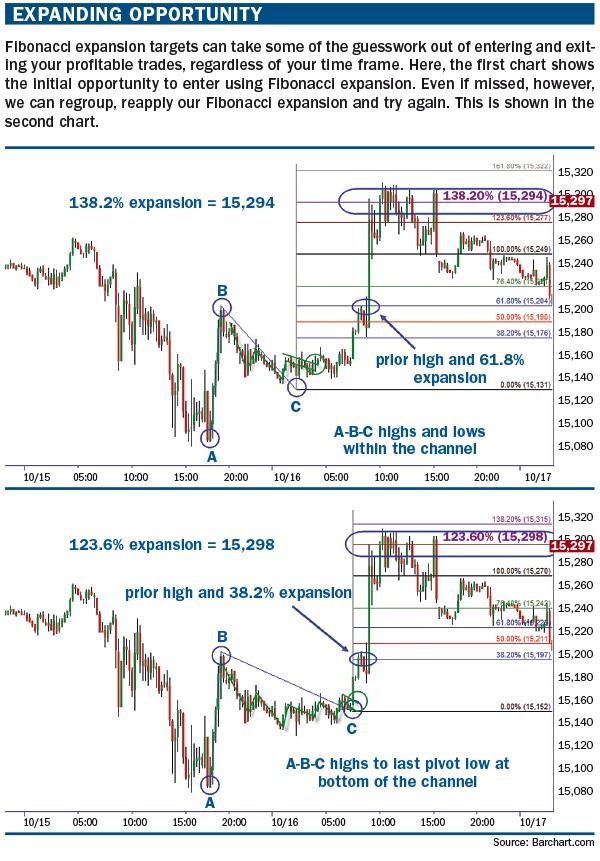
In the E-mini Dow trade, we look at two different price points that were used for the third anchor in the Fibonacci expansion. In the first chart in “Expanding opportunity,” you will find the most commonly used third anchor: The low of the trading channel. The 100% expansion of this move meant that the primary target would have been 15,249. Instead, the breakout move took the YM into the 138.2% expansion zone of 15,294.
There are several reasons for this larger price move on this particular breakout. First, the Dow congestion held within the middle of the original impulse wave of buying. This created stronger resistance at the prior highs, which you will note corresponded to the 61.8% Fibonacci expansion level in the first chart. Second, once those highs broke, the pace of the buying was much stronger than the original impulse wave. When this is the case, it is more common for the breakout move to aim for higher expansion levels than 100%.
Alternately, if the breakout move had been slower than the original impulse wave, it may have been necessary to adjust for a lower Fibonacci target, such as the 61.8% level that paused the original breakout.
The second chart includes an alternate Fibonacci expansion based upon using the last low in the tightest portion of the congestion as the third anchor point. While the absolute low is the most common third anchor, often a 100% expansion target based upon this last pivot low tends to hold most often when the pace of a breakout move is similar to the pace or momentum of the impulse move. This meant that 15,270 would be the most common target going into a position such as this one.
Notice, however, that a number of the Fibonacci resistance levels that result from using the last low within the congestion itself as the third anchor point are almost identical to those in the first chart. The only difference is the percentage label attached to each level. The 38.2%, 76.4% and 123.6% Fibonacci expansions in the second chart are each within a few ticks of the 61.8%, 100% and 138.2% Fibonacci expansion levels in the first chart. Either method would have yielded comparable price points as targets. While the increased momentum on the breakout allowed the Dow futures to push past the typical 100% expansion target, using the Fibonacci expansion tool demonstrated that we were working with the next target zone, removing some guesswork from the trade.
While Fibonacci expansion is an excellent tool to help traders visualize target points on continuation strategies, other popular Fibonacci tools, such as retracements and fans, offer traders a similar edge. The particular tool varies depending upon the type of strategy being traded and whether or not you are timing an entry or exit. Regardless, if you want to improve your trading and build consistency in your models, Fibonacci expansion is a solid tool to have.


")
