

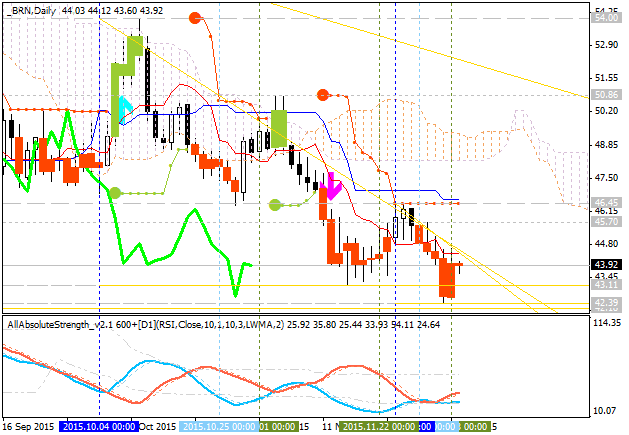
The price is located below Ichimoku cloud for the primary bearish area of the chart with the secondary ranging within the following key reversal s/r levels:
- 42.16 support level located far below Ichimoku cloud in the primary bearish area of the daily chart, and
- 50.86 resistance level located near and above Ichimoku cloud in the primary bullish area of the chart.
Intermediate support/resistance levels for the price to go to the key reversal levels are the following:
- 46.45 resistance level located on the border between the primary bearish and the primary bullish trend on the chart, and
- 42.39 support level located in the bearish area.
Absolute Strength indicator is estimating the bearish trend to be continuing.
If the price will break 46.45
resistance level on close daily bar so the reversal of the price
movement from the primary bearish to the primary bullish market
condition will be started with the secondary ranging.
If the price will break 50.86
resistance level from below to above on close bar so the price
will be fully reversed to the primary bullish condition in this case.
If the price will break 42.16
support level so the primary bearish trend will be continuing.
If not so the price will be ranging within the levels.
| Resistance | Support |
|---|---|
| 46.45 | 42.39 |
| 50.86 | 42.16 |
- Recommendation for long: watch close daily price to break 46.45 for possible buy trade with 50.86 target to re-enter
- Recommendation
to go short: watch the price to break 42.16 support level for possible sell trade
- Trading Summary: ranging near daily reversal area


 Trading Guide")

")