
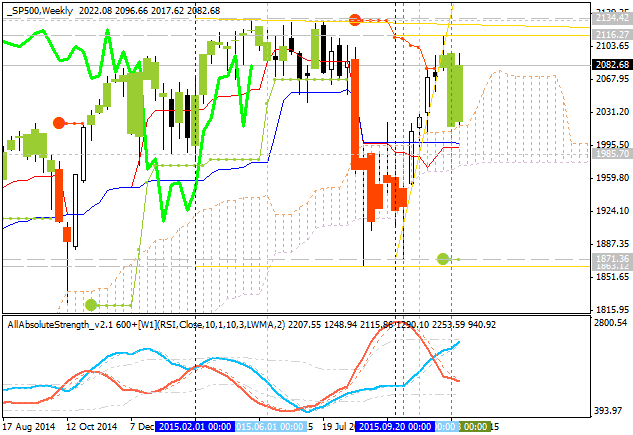
Quick Technical Overview - S&P 500: ranging near bearish reversal area

Ichimoku analysis.
Weekly price is on bullish market
condition for the ranging near bearish reversal area of the chart: the price is located near and above Ichimoku cloud and 'reversal'
Sinkou Span line which is the border between the primary bullish and the
primary bearish on the chart. There are the following key reversal support/resistance levels for the price for now:
- 2134.42 resistance level located above Ichimoku cloud in the bullish area of the chart; if the price breaks this level from below to above so the bullish trend will be continuing; and
- 1863.12 support level located below Ichimoku cloud in the bearish area of the chart; if the price breaks this level to below so the price will be reversed from the primary bullish to the primary bearish market condition.
Absolute Strength indicator is estimating the bullish trend to be continuing in the future.
Pivot
Points.
The price is on bullish condition for the ranging between R1 YR1 Pivot at 2188.18 and Central Pivot at 1963.05. If the price crosses Central
Pivot so we may see the global reversal of S&P 500 to the
primary bearish market condition, otherwise - ranging bullish condition will be continuing.

| Instrument | S1 Pivot | Yearly PP | R1 Pivot |
|---|---|---|---|
| S&P 500 |
1832.78 |
1963.05 |
2188.18 |


")
![[XAUUSD]: Weekly Liquidity Activation Points (timings), June 22-26, 2026](https://c.mql5.com/6/1013/splash-preview-771790.png "[XAUUSD]: Weekly Liquidity Activation Points (timings), June 22-26, 2026")
