

Deutsche Bank made a short forecast suggesting to sell NZD/JPY for this week so let's evaluate the situation with the technical point of view.
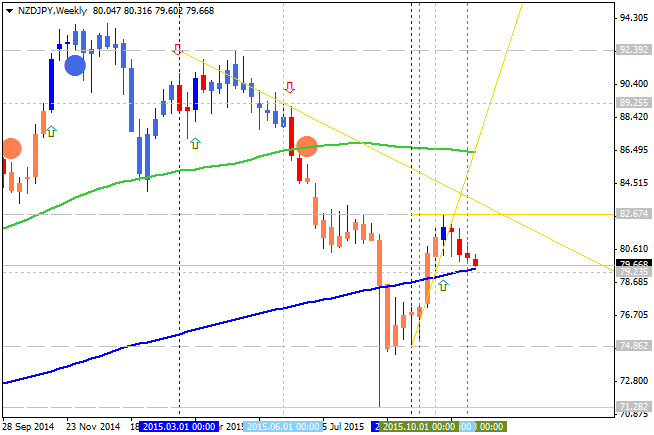
NZD/JPY: weekly bearish reversal. The pair is on ranging market condition located near 200 period SMA (200 SMA) on the border between the primary bearish and the primary bullish trend on the chart.
The key reversal levels for the pair are the following:
- 92.39 resistance level located above 100 SMA/200 SMA in the bullish area of the chart, and
- 71.28 support level located below 100 SMA/200 SMA in the bearish area of the chart.
There are intermediate support/resistance levels for the price on the way to the key reversal levels:
- 89.25 bullish resistance level, and
- 74.86 bearish support level.
There are 3
simple scenarios for the price movement for the week:
- bearish reversal will be started in case the price breaks 74.86 support with 71.28 as the next bearish target,
- bullish reversal to be started in case the price breaks 89.25 resistance from below to above with 92.39 as the next bullish target,
- or the ranging within the levels.
There are the following news events which will be affected on NZD/JPY price movement for the week:
- 2015-11-18 19:00 GMT | [USD - FOMC Meeting Minutes]
- 2015-11-18 21:45 GMT | [NZD - Producer Price Index]
- 2015-11-18 23:50 GMT | [JPY - Trade Balance]
- 2015-11-19 n/a GMT | [JPY - Monetary Policy Statement]
- 2015-11-19 15:00 GMT | [USD - Philadelphia Fed Business Outlook Survey]
| Resistance | Support |
|---|---|
| 89.25 | 74.86 |
| 92.39 | 71.28 |


 & AMD Framework")
")