

0
1 111
Weekly price is on bullish market condition located to be above Ichimoku cloud for the secondary ranging between the following key reversal support/resistance levels:
- 2134.42 resistance level located far above Ichimoku cloud in the bullish area of the chart; if the price breaks this level so we may see good bullish breakout; and
- 1863.12 support level located far below Ichimoku
cloud in the bearish area of the chart; if the price breaks this level
so the bearish breakdown may be started.
There are intermediate support/resistance levels which the price should cross on the way to the reversal levels:
- 2116.27 resistance level located near and above the border between the primary bearish and the primary bullish on the chart; if the price breaks this level from below to above so the bullish trend will be continuing the secondary ranging condition; and
- 1953.32 support level located
near and below Ichimoku cloud in the primary bearish area of the chart;
if the price breaks this level from above to below so we may see the
reversal to the bearish market condition with the secondary ranging.
Chinkou Span line is located to be below and near the price indicating the ranging condition by direction. Absolute Strength indicator is estimating the bullish trend to be continuing.
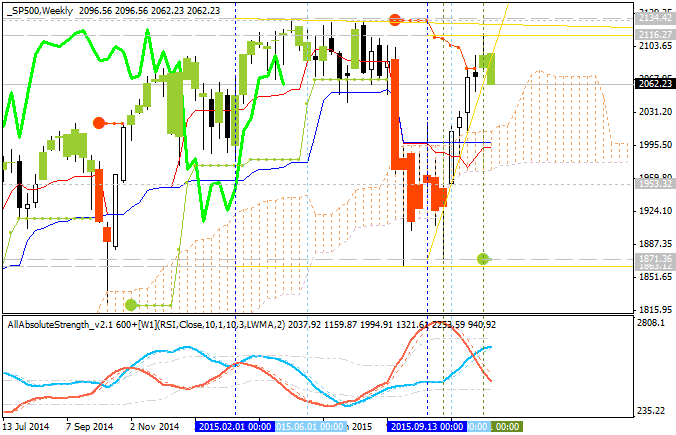
- watch close price to break 2116.27 resistance level for possible buy trade with 2134.42 as the target;
- watch price to break 1953.32 support level for possible sell trade with 1863.12 as the target.


")