
Technical Analysis for EUR/JPY: weekly breakdown, monthly bearish reversal
6 November 2015, 09:11

0
2 637
According to updated long-term forecast made by Goldman Sachs - the price for this pair will be on strong bearish market condition with 124.0 as a final target by the end of 2016:
| Instrument | Q1 Jan'16 | Q2 Apr'16 | Q4 Oct'16 |
|---|---|---|---|
| EUR/JPY | 124.0 | 125.0 | 124.0 |
As
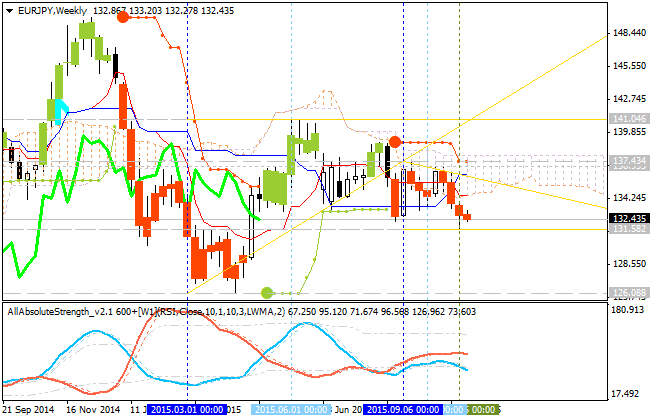
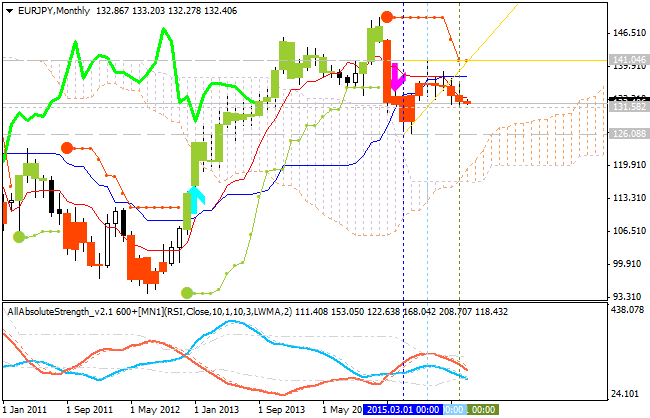
we see from the charts above (W1 timeframe and MN1 timeframe for
EUR/USD) - 126.08 is the key support level for this pair for both
timeframes:
- on W1 timeframe - the price is located below Ichimoku cloud for the bearish breakdown to be started; descending triangle pattern was formed by the price to be crossed for the bearish trend to be continuing;
- monthly chart - the price is located to be above Ichimoku cloud for the bullish market condition with the secondary correction: price is trying to break 131.58 support level to below with 126.08 as the next reversal target.
Chinkou Span line is crossing the price from above to below indicating the good possible breakdown of the price movement in the near future.
Thus, the most likely scenario for this pair in the long-term situation is to break 126.08 support level from above to below with good breakdown way for the bearish monthly reversal.


")
![[XAUUSD]: Weekly Liquidity Activation Points (timings), June 22-26, 2026](https://c.mql5.com/6/1013/splash-preview-771790.png "[XAUUSD]: Weekly Liquidity Activation Points (timings), June 22-26, 2026")
