
NZD/USD Price Action Analysis - attempting to launch a recovery
26 October 2015, 15:11

0
1 322
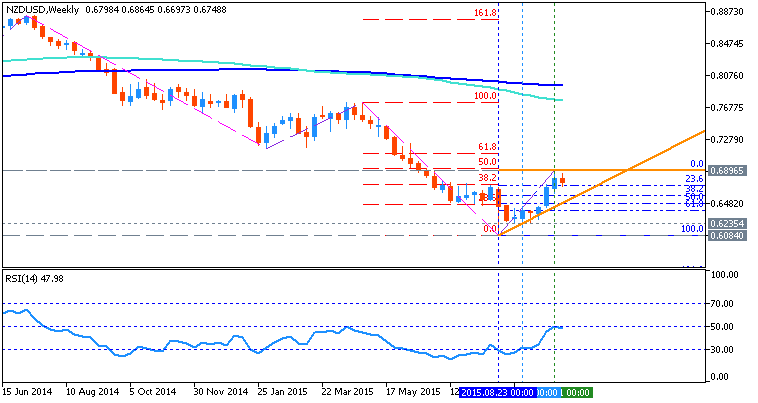
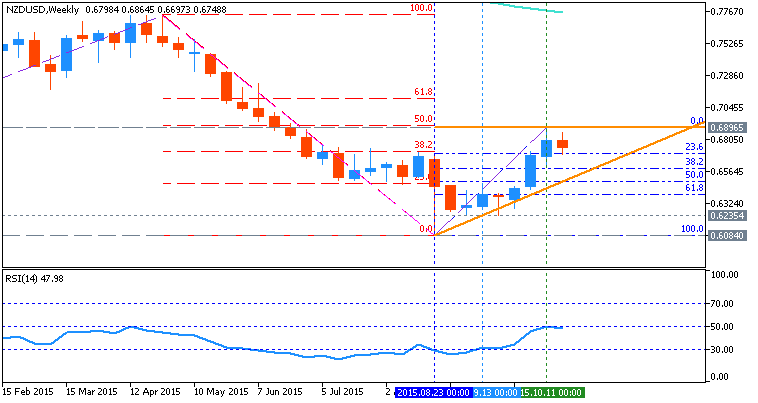
W1 price is is on bearish market condition located below 200 period SMA (200 SMA) and 100 period SMA (100 SMA) for the secondary ranging between 0.6084 Fibo support level and 0.6896 Fibo resistance level:
- Ascending triangle pattern was formed by the price to be crossed Fibo resistance level at 0.6896 from below to above for the bear market rally to be started.
- "The New Zealand Dollar is attempting to launch a recovery after finding support near the 0.67 figure against its US namesake. Downside follow-through after the formation of a bearish Dark Cloud Cover candlestick pattern has proved lacking, though the pattern remains technically valid absent a close above its swing high."
- "A daily close above the 14.6% Fibonacci expansion at 0.6795 opens the door for a challenge of the 23.6% level at 0.6854."
- "On one hand, prices are too close to resistance to justify a long
position from a risk/reward perspective. On the other, the absence of
bearish follow-through suggests taking up the short side is at best
premature."
- If weekly price will break Fibo resistance level at 0.6896 from below to above so the local uptrend as the secondary rally will be started; if not so we will see the ranging market condition within the primary bearish trend.
Trend:
- D1 - ranging for waiting for direction
- W1 - ranging bearish
- MN1 - ranging for waiting for direction


