
NZDUSD Price Action Analysis - descending triangle pattern to be crossed for breakdown
18 September 2015, 06:11

0
1 237
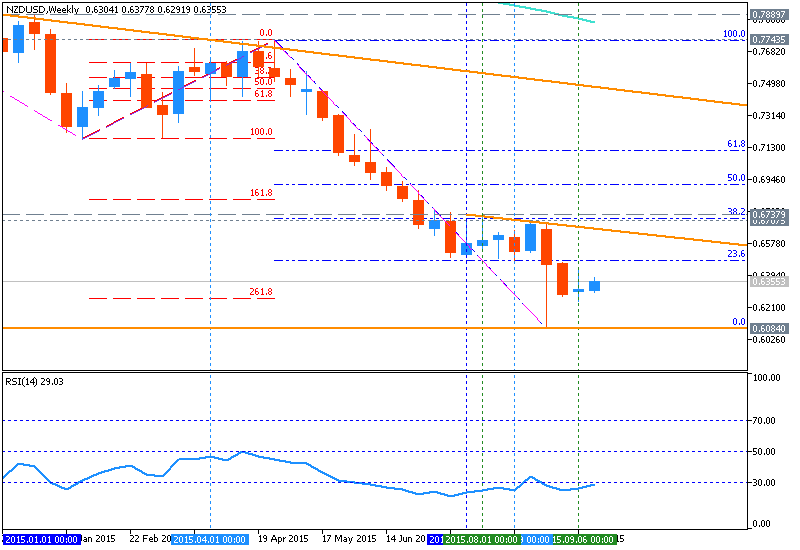
W1 price is located below 200 period SMA and 100 period SMA for the primary bearish with secondary ranging between Fibo support level at 0.6084 and 38.2% Fibo resistance level at 0.6737:
- The price is ranging between Fibo support at 0.6084 and 23.6% Fibo resistance at 0.6475;
- Descending triangle pattern was formed for the price to be broken from above to below for the bearish trend to be continuing;
- If weekly price will break 0.7552 support
level so the primary bearish will be cintinuing, otherwise the price will be ranging within the familiar levels;
- "The New Zealand Dollar continues to oscillate in a well-defined
rangeabove the 0.62 figure against its US namesake. The dominant trend
continues to look decidedly bearish, painting the current standstill as
digestion preceding the resumption of downward momentum."
- "Near-term support is in the 0.6219-44 area, marked by the 38.2% Fibonacci expansion and the September 7 low. A break below this barrier on a daily closing basis opens the door for a test of the 50% level at 0.6069. Alternatively, a move above the 23.6% Fib at 0.6406 clears the way for a challenge of the 0.6497-0.6521 zone, bracketed by the July 16 low and the 14.6% expansion."
Trend:
- W1 - ranging bearish


")

![[XAUUSD]: Weekly Liquidity Activation Points (timings), June 22-26, 2026](https://c.mql5.com/6/1013/splash-preview-771790.png "[XAUUSD]: Weekly Liquidity Activation Points (timings), June 22-26, 2026")