

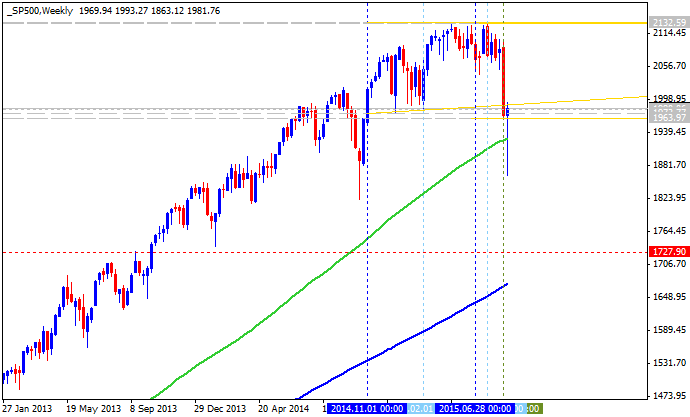
W1 price is located above 200 period SMA and 100 period SMA for the primary bullish with secondary correction started - the price came to be very close to 100-SMA for breaking it from above to below for ranging bullish market condition:
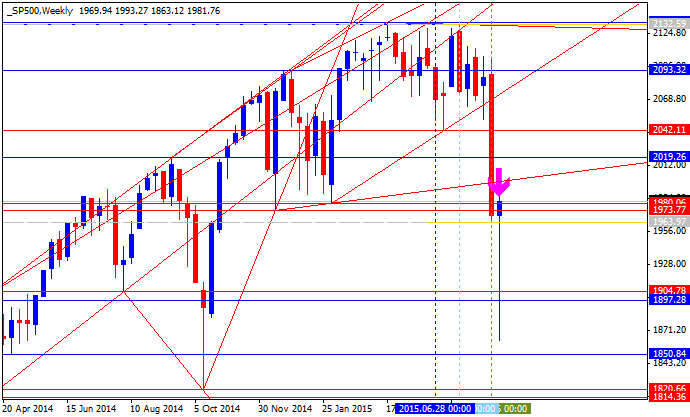
- "Near-term resistance is now at 2018.50, the 61.8% Fibonacci retracement. A daily close above this threshold clears a path to test range floor support-turned-resistance at 2042.70, followed by the 76.4% level at 2062.20. The formation of a Hanging Man candlestick may precede the return of selling pressure however. A reversal back below the 50% retracement at 1983.20 opens the door for a challenge of the 14.6% Fib expansion at 1951.70."
- "The S&P 500 paused to digest gains after launching higher as expected following the appearance of an Inverted Hammer candlestick. Prices recovered to within a hair of the 2000 figure in a mere two days having dropped to a 10-month low above the 1800 threshold from a range just below record highs in only four sessions."
Trend:
W1 - correction


")

")