
EURUSD Technical Analysis 2015, 23.08 - 30.08: weekly breakout

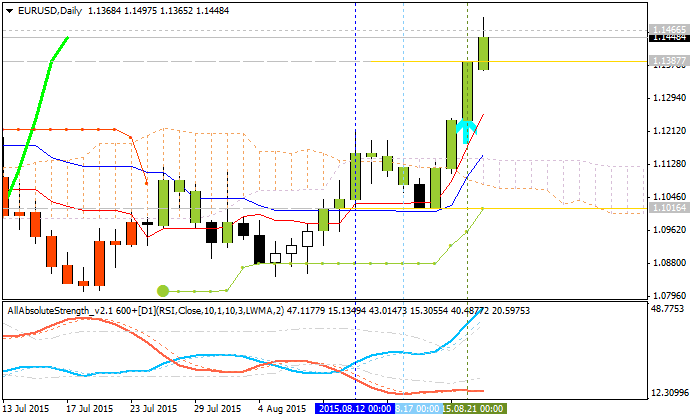
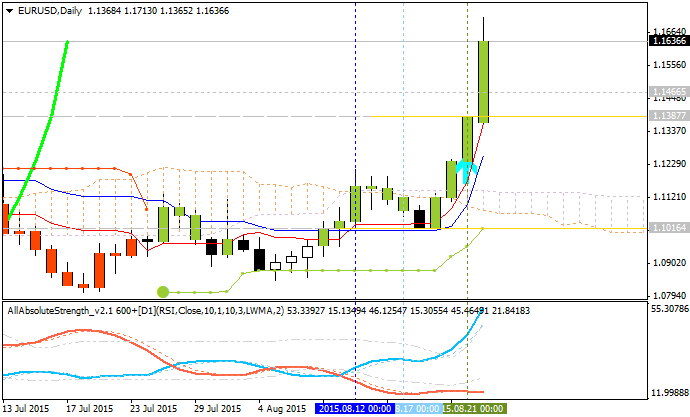
Daily price was reversed to the bullish market condition by
breaking Ichimoku cloud from below to above. The price broke
1.1409 resistance level on the way to 1.1466 bullish target. Chinkou
Span line is indicating the breakout, and Tenkan-sen line is above
Kijun-sen for the bullish trend to be continuing. If the price breaks
1.1466 resistance so the bullish trend will be continuing, if the price
breaks 1.1213 so the secondary correction will be started.
D1 price - bullish breakout:
- Tenkan-sen line is above Kijun-sen line for bullish market condition.
- Absolute Strength indicator's data is for strong bullish condition to be continuing.
- Chinkou Span line is indicating the bullish breakout by direction.
- 'Reversal' Senkou Span line as the border between the primary bullish and the primary bearish on the chart is located below the price.
- Nearest key support levels are are 1.1213 and 1.0807.
- Nearest key resistance level is 1.1466.
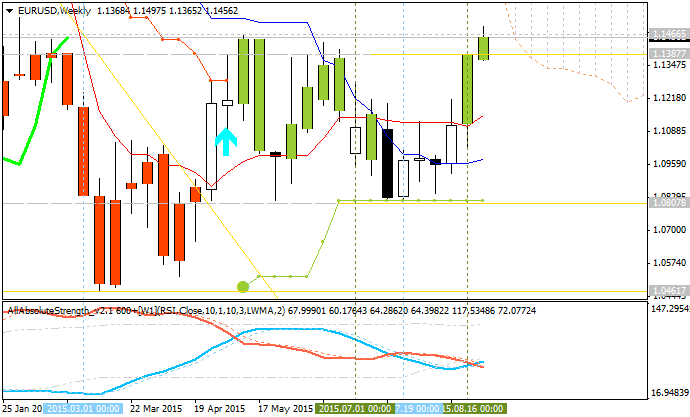
W1 price
is on bearish market condition with the breakout to be started: Chinkou Span line is indicating breakout with 1.1466 nearest resistance level.
MN price
is on ranging bearish with 1.0461 support level.
If D1 price will break 1.1213
support level on close D1 bar so we may see the secondary correction within the primary bullish market condition.
If D1 price will break 1.1466 resistance level so the bullish trend will be continuing.
If not so the price will be on ranging between the levels.
- Recommendation for long: watch close D1 price to break 1.1466 for possible buy trade
- Recommendation
to go short: watch D1 price to break 1.1213 support level for possible sell trade
- Trading Summary: ranging
| Resistance | Support |
|---|---|
| 1.1409 (D1) | 1.1213 (D1) |
| 1.1466 (W1) | 1.0807 (W1) |
| 1.1466 (MN1) | 1.0461 (MN1) |
SUMMARY : bullish


")

![[XAUUSD]: Weekly Liquidity Activation Points (timings), June 22-26, 2026](https://c.mql5.com/6/1013/splash-preview-771790.png "[XAUUSD]: Weekly Liquidity Activation Points (timings), June 22-26, 2026")