
Goldman Sachs - Elliot Wave technical analysis on the daily EUR/USD
17 August 2015, 15:11

1
3 015
Goldman Sachs made Elliot Wave technical analysis on the daily EUR/USD and those are the following comments (below the chart):
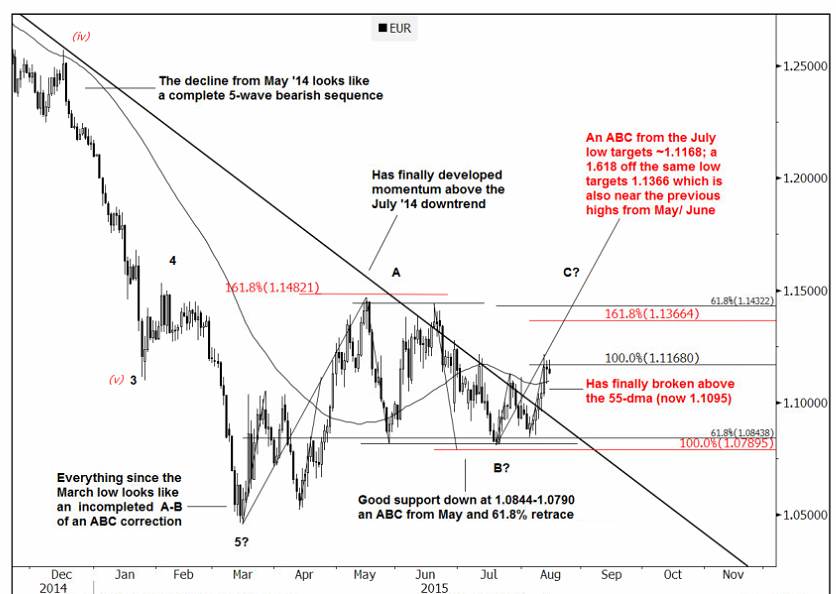
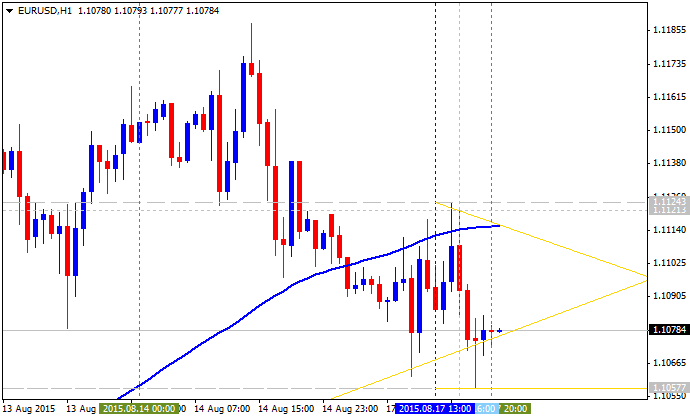
- "Has finally sustained a break above its 55-dma and the July '14 downtrend".
- "Both of these levels have been very relevant to recent price action. The 55-dma in particular held the entire decline from the May '13 high to early-Apr. '15. It should now act as important support at 1.1095."
- "The next big pivot to focus on is 1.1168; an ABC from the Jul. 20 th low. A close above will open potential for a 1.618 extension target to 1.1366. This also happens to be close to the previous two highs from May/June (1.1438-68) and a 0.618 extension from March (1.1432)."
- "Overall, seems the next two big levels are 1.1168 and then 1.1366-1.1468."
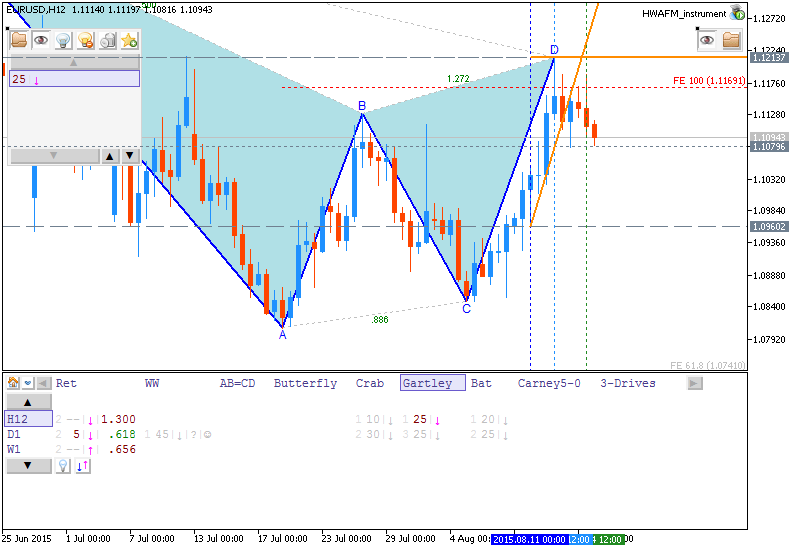
If we look at the other patterns so we can see just two situations around: short-term (forming bearish patterns) and long-term (forming bullish patterns).
Short-term scenario
This is forming bearish gartley for H12 timeframe:
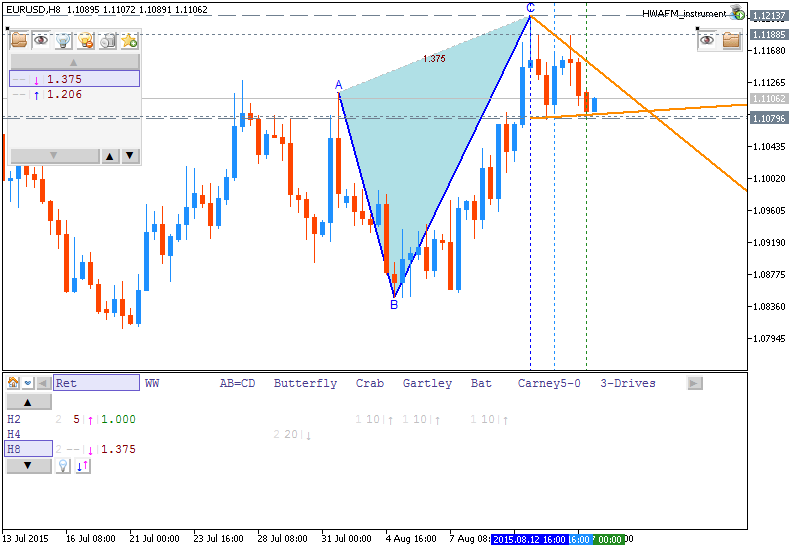
This is the forming bearish retracement pattern for H8 timeframe:
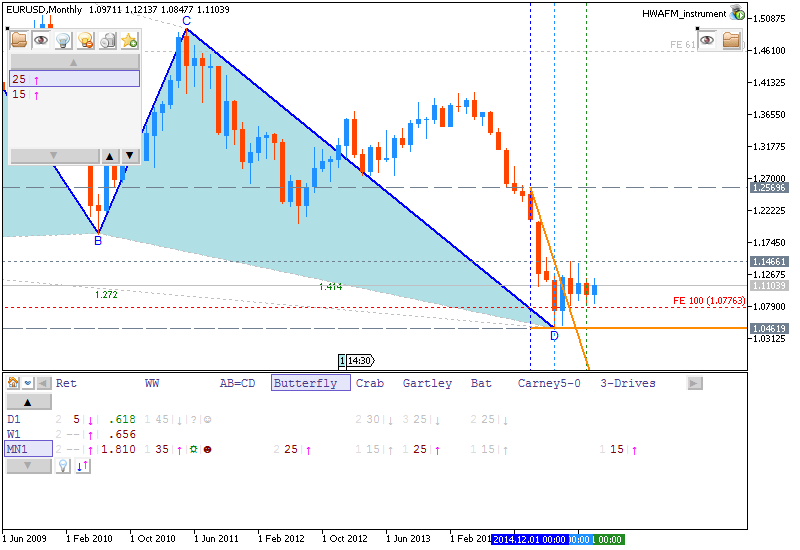
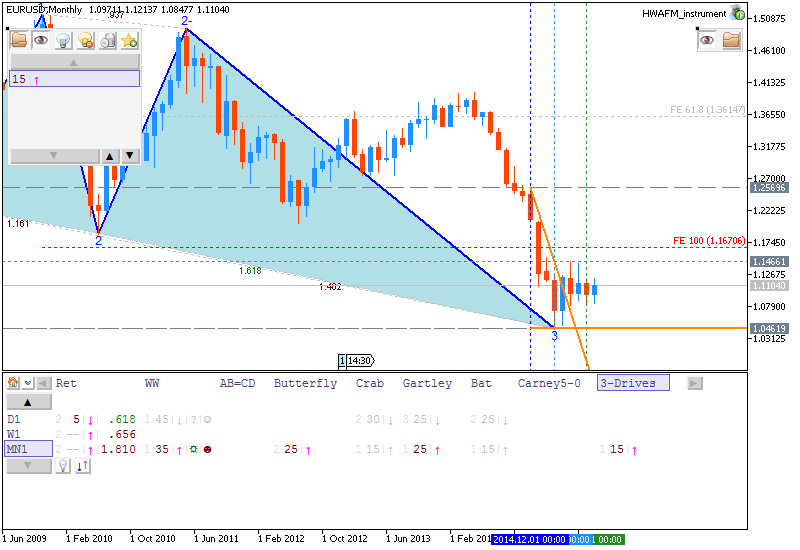
Long-tern situation with bullish
Forming bullish butterfly pattern and forming bullish 3-Drives pattern for MN1:


")
![[XAUUSD]: Weekly Liquidity Activation Points (timings), June 22-26, 2026](https://c.mql5.com/6/1013/splash-preview-771790.png "[XAUUSD]: Weekly Liquidity Activation Points (timings), June 22-26, 2026")
