")

Weekly price is on bullish market condition for ranging between 93.13 support level and 98.15 resistance level:
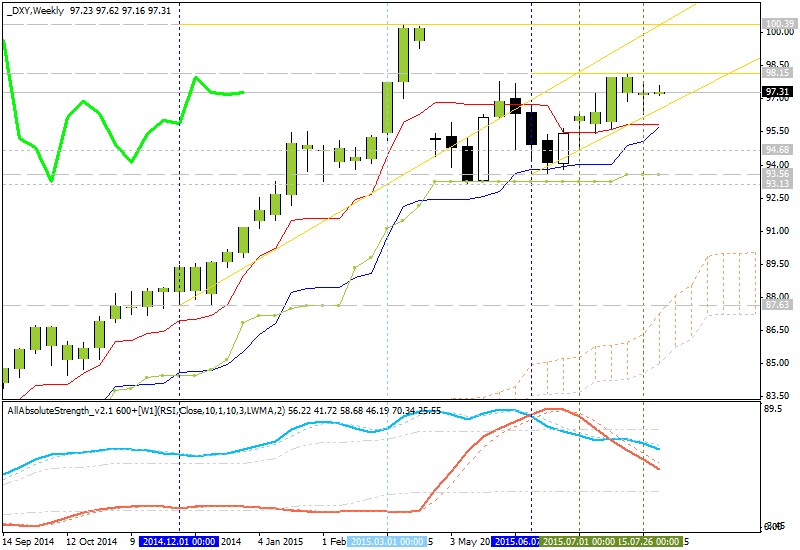
- Chinkou Span line is located to be above the price with the secondary flat by direction.
- The nearest resistance level is 98.15, and the next level is 100.39.
- Absolute Strength indicator is estimating the secondary flat.
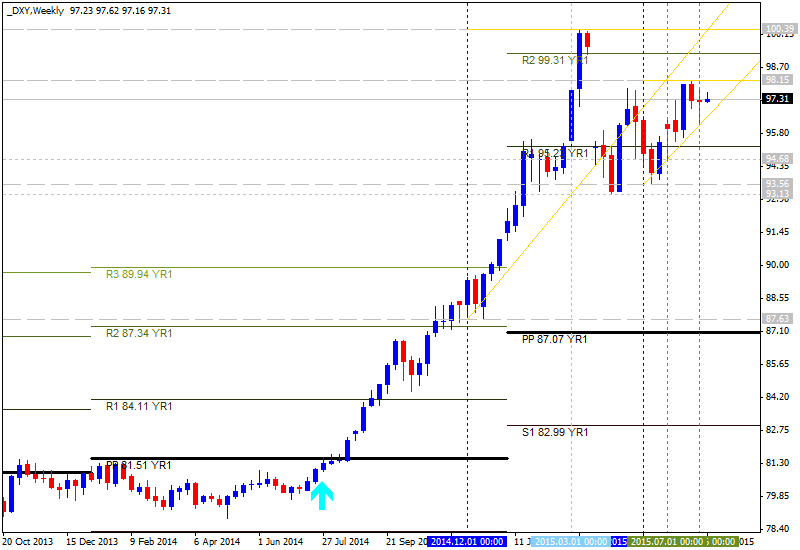
- Pivot Points (yearly PP on weekly chart): the price is ranging between R1 Pivot at 95.28 and R2 Pivot at 99.31.
| Instrument | S1 Pivot | Yearly PP | R1 Pivot | R2 Pivot |
|---|---|---|---|---|
| DXY | 82.99 | 87.07 |
95.28 | 99.31 |
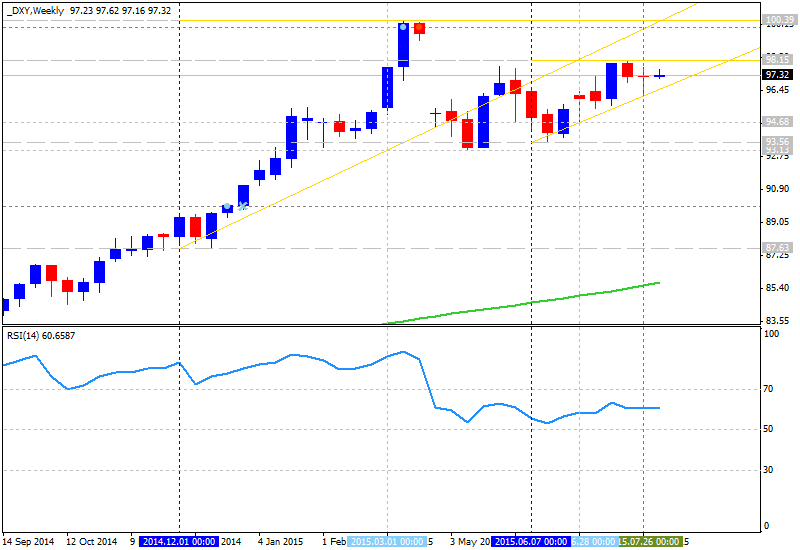
If W1 price will break 93.13
support level on close W1 bar so the secondary correction will be
started with good possibility to the reversal of the price movement to the ranging bearish market condition with next target as 87.63.
If W1 price will break 98.15 resistance level on close W1 bar so the bullish trend will be continuing with the secondary ranging up to 100.39 as the next target.
If not so the price will be ranging between the levels.
Trend:


