
EURJPY Price Action Analysis - descending triangle pattern with 50.0% Fibo support level

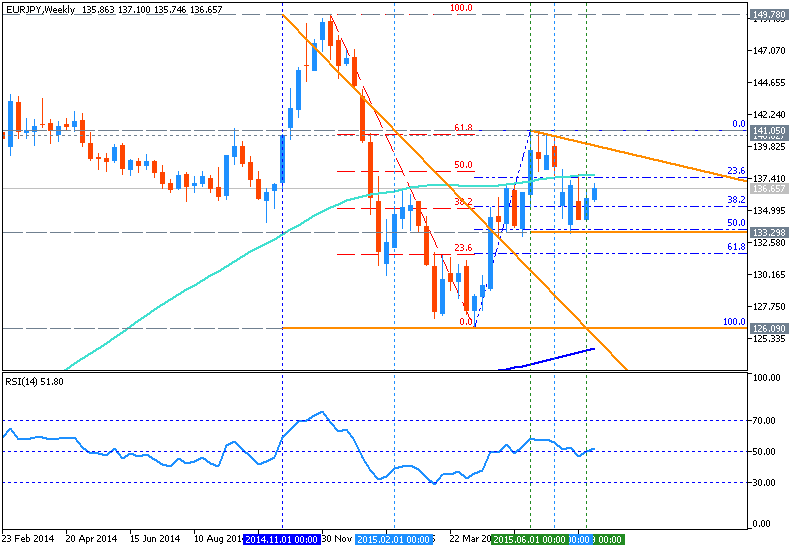
W1 price is located above 200 period SMA
(200-SMA) and below 100 period SMA (100-SMA) for the primary bullish with
secondary ranging
between Fibo resistance level at 141.05 and 50.0% Fibo support level at
133.29. The price is trying to cross 100-SMA from below to above for the primary bullish to be continuing. But on the same time - we see the descending triangle pattern with 50.0% Fibo support level at
133.29 which may be broken by price from above to below for the correction to be started.
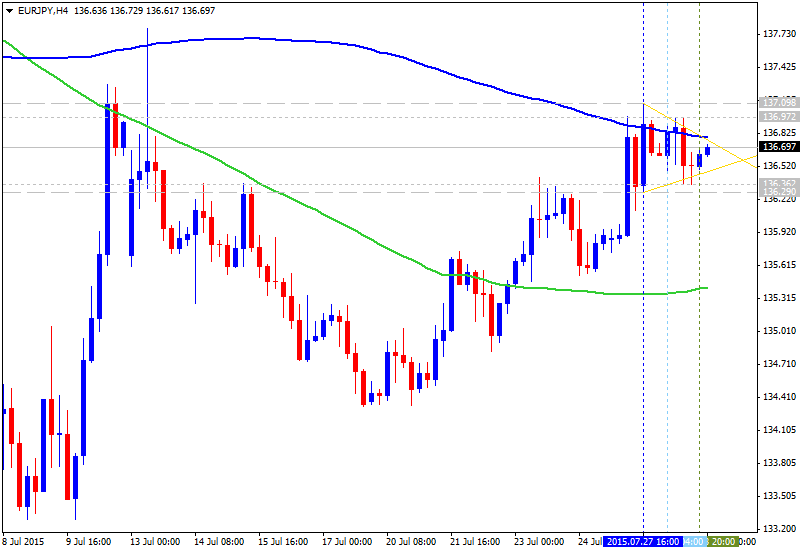
- the price is trying to cross 100-SMA from below to above for the primary bullish to be continuing;
- the descending triangle pattern with 50.0% Fibo support level at 133.29 was formed and may be crossed by the price from above to below for the secondary to be started.
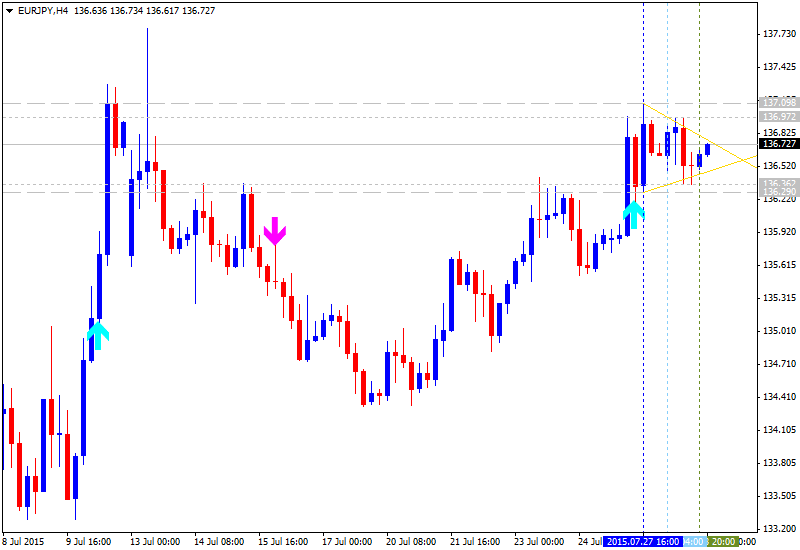
If the price will break 50.0% Fibo support level at
133.29 so we may see the secondary correctional trend to be started within the primary bullish condition.
If the price will break Fibo resistance level at 141.05 from below to above so the primary bullish trend will be continuing with good possible breakout of the price movement.
If not so the price will be ranging between support level at 133.29 and resistance level at 141.05.
Trend:


")
![[XAUUSD]: Weekly Liquidity Activation Points (timings), June 22-26, 2026](https://c.mql5.com/6/1013/splash-preview-771790.png "[XAUUSD]: Weekly Liquidity Activation Points (timings), June 22-26, 2026")
")