
S&P 500 Technical Analysis At Year-End: correction with 1980 key target

Let's make such a prediction at year-end for S&P 500 using the following simple technical analysis tools:
- support and resistance lines, and
- Simple Moving Averages indicator (which is standard indicator in Metatrader 4 and Metatrader 5)
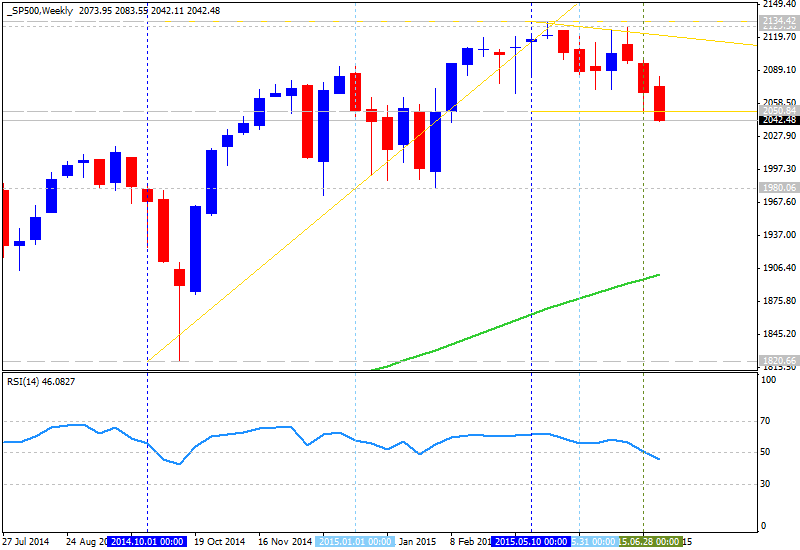
As we see from the charts below (W1 timeframe and MN1 timeframe for S&P 500) - 1980.06 is the key support level for S&P 500 for both timeframes. On W1 timeframe - the price is located to be above 100 SMA and above 200 SMA for primary bullish market condition with secondary correction as a local downtrend: the price is trying to break 2050.84 support level from above to below for the correction to be continuing. And the next target for the price to go down is 1980.06.
MN1 timeframe: the price is on bullish trend with the correction which is started last week only, and the nearest support level for the price is 1980.06
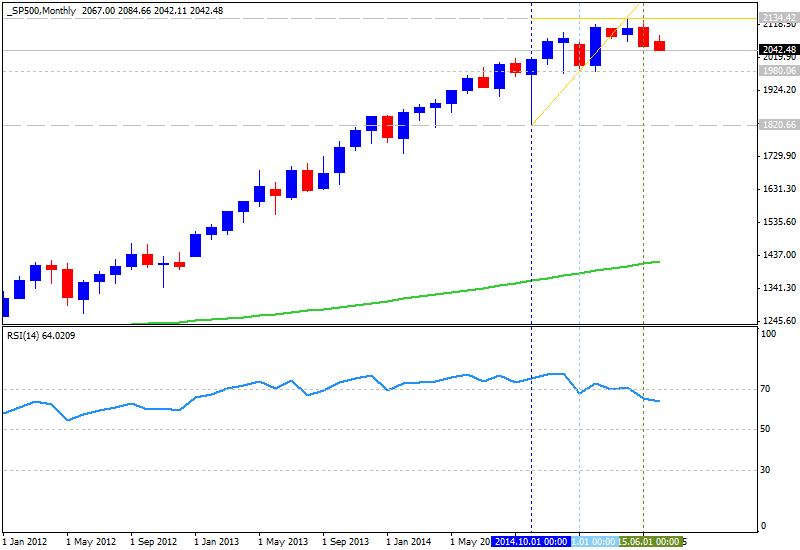
Thus, we can estimate the bullish market condition with the correction started with 1980 key target for S&P 500 at year-end.


")

")