0
234
US DOLLAR TECHNICAL ANALYSIS
Prices paused to digest losses after sliding to the weakest level in three weeks. Near-term support is at 11834-9 area (May 20 close, 50% Fibonacci retracement), with a break below that on a daily closing basis exposing the 61.8% level at 11790.
S&P 500 TECHNICAL ANALYSIS
GOLD TECHNICAL ANALYSIS
Prices paused to digest losses after sliding to the weakest level in three weeks. Near-term support is at 11834-9 area (May 20 close, 50% Fibonacci retracement), with a break below that on a daily closing basis exposing the 61.8% level at 11790.
S&P 500 TECHNICAL ANALYSIS
Prices are stalling after launched a recovery at rising trend line support set from late-March lows. A break above trend line resistance at 2109.50 exposes the 50% Fibonacci expansion at 2119.10.

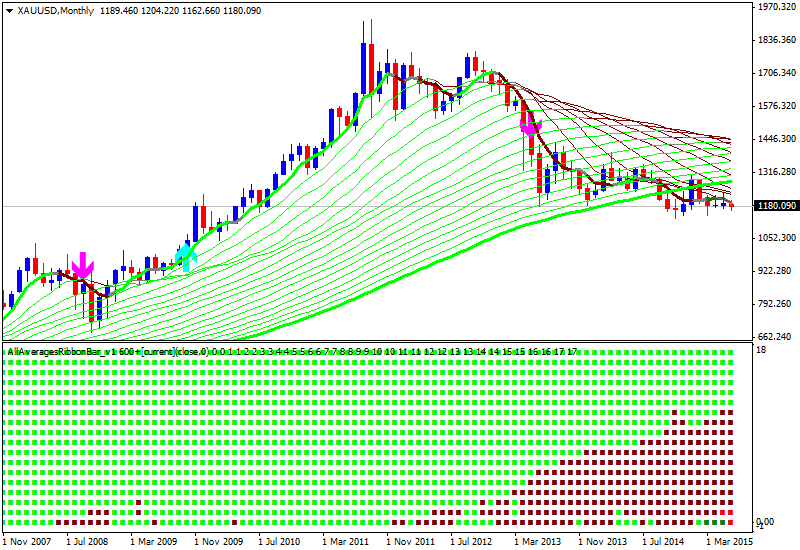
GOLD TECHNICAL ANALYSIS
Prices narrowly edged above falling channel resistance, warning that the down move from mid-May highs may be unraveling. A break of trend line resistance at 1201.02 exposes the May 18 high at 1232.30.